Products
SentimenTrader Trading Tools
‍
Backtest Engine
My Trading Toolkit
Correlation Analysis
Seasonality
Market Prediction
Indicators & Data API
‍
Proprietary Indicators & Charts
Market Data API
Strategies & Scanner
‍
50+ Trading Strategies
Smart Stock Scanner
Smart Option Scanner
Research Reports
‍
Research Solutions
Reports Library
Free Resources
Simple Backtest Calculator
Simple Seasonality Calculator
The Kelly Criterion Calculator
Sentiment Geo Map
Public Research Reports
Education
Sentiment Indicators
Technical Indicators
Pricing
Company
About
In the News
Testimonials
Client Success Stories
Contact
Log inLoginSign up
< BACK TO ALL REPORTS

VXX Optix provides another favorable sign for stock traders

Jay Kaeppel
2021-12-10
A spike in the VIX Index is a typical reaction to sharply declining stock prices. But once that spike loses steam and begins to reverse, it often provides a handy bullish signal for stock traders.

Key Points

  • VXX is an ETF that tracks VIX futures
  • VXX tends to spike higher when the stock market falls hard as VXX traders quickly become more bullish (on the prospect for higher volatility)
  • When that optimism among volatility traders wanes, it is a favorable sign for stocks over the next 6-12 months
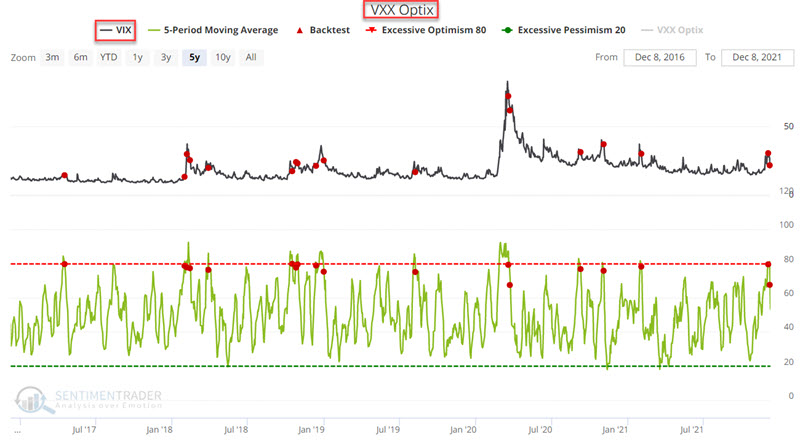
Spikes in VXX Optix

The VIX Index tends to move inversely to stock prices, so when prices fall, volatility tends to pick up and vice-versa. VXX is an ETF designed to track VIX futures. VXX does not track the VIX Index very closely for technical reasons related to futures pricing. Still, when stock prices fall hard, the VIX tends to spike higher, VIX futures do the same, and so - to some extent - does VXX. 

When this happens, VXX traders tend to get very optimistic very quickly - essentially believing that a major stock market decline is just beginning. However, more often than not, that optimism is misplaced. Optimism generally fades quickly, and VIX, VIX futures, and VXX reverse sharply.

To illustrate, the chart below displays the action of the VIX Index itself following times when the 5-day average of VXX Optix dropped below 80.

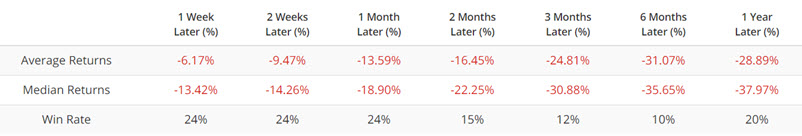
As you can see in the table below, the VIX Index tends to fall hard following these signals. The good news is that the VIX Index "falling hard" is almost invariably associated with higher stock prices.
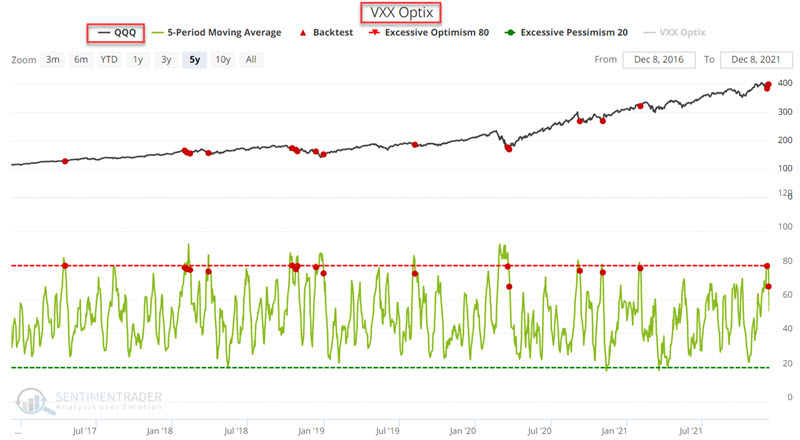
QQQ and VXX Optix

The chart below displays the action of QQQ (which tracks the Nasdaq 100 Index) following times when the 5-day average of VXX Optix dropped below 80.

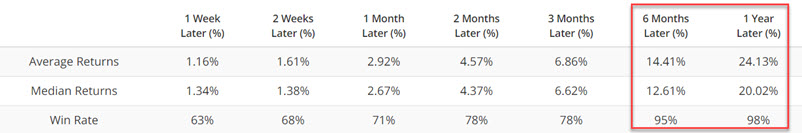
As you can see in the table below, future six and 12-month results have been quite favorable. 

What the research tells us:

In the past ten years (since VXX began trading), reversals in the 5-day average of VXX Optix from above 80 to below 80 have invariably been followed by higher stock prices in the next 6-12 months. There are, of course, never any guarantees that this will continue to be the case. But until proven otherwise, the recent signals on 12/3 and 12/7 offer another reason for bullish stock traders to push on.

PRODUCTS
SentimenTrader
Trading Tools
Indicators & Data API
‍
Strategies & Scanner
‍
Research Reports
FREE
RESOUrCES
Simple Backtest
Calculator
Simple Seasonality
Calculator
The Kelly Criterion
Calculator
Sentiment Geo Map
‍
Public Research Reports
‍
Education
Sentiment Indicators
‍
Technical Indicators
‍
Pricing
Bundle pricing
‍
FAQ
‍
Announcements
‍
COMPANY
‍
About
‍
In the News
‍
Testimonials
‍
Client Success Stories
CONTACT
‍
General Inquiries
‍
Media Inquiries
‍
Financial Professionals Inquiries
‍
© 2026 Sundial Capital Research Inc. All rights reserved.
Setsail Marketing
TermsPrivacyAffiliate Program
Risk Disclosure: The information and tools provided are for research and analytical purposes only and are not intended as investment advice. Market analysis involves uncertainty, and outcomes may differ from expectations. Users should conduct their own due diligence and consider their individual circumstances before making any financial decisions. Past performance is not necessarily indicative of future results.

Hypothetical Performance Disclosure: Hypothetical performance results have many inherent limitations, some of which are described below. No representation is being made that any account will or is likely to achieve profits or losses similar to those shown; in fact, there are frequently sharp differences between hypothetical performance results and the actual results subsequently achieved by any particular trading program. One of the limitations of hypothetical performance results is that they are generally prepared with the benefit of hindsight. In addition, hypothetical trading does not involve financial risk, and no hypothetical trading record can completely account for the impact of financial risk of actual trading. for example, the ability to withstand losses or to adhere to a particular trading program in spite of trading losses are material points which can also adversely affect actual trading results. There are numerous other factors related to the markets in general or to the implementation of any specific trading program which cannot be fully accounted for in the preparation of hypothetical performance results and all which can adversely affect trading results.

Testimonial Disclosure: Testimonials appearing on this website may not be representative of other clients or customers and is not a guarantee of future performance or success.