
Volatility subsided, triggering a composite washout model alert

Key points:
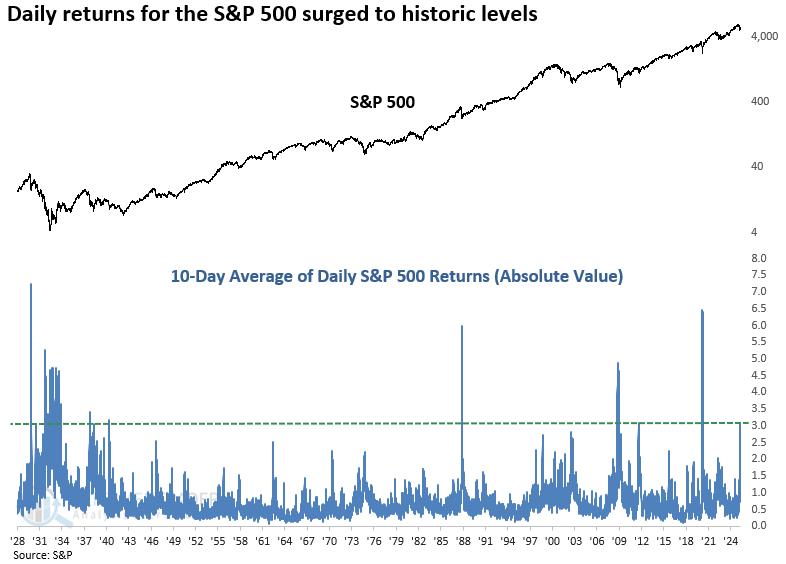
- The S&P 500's 10-day moving average of daily returns dipped below 2%, reflecting diminished volatility
- Similar contractions in volatility suggest a more favorable backdrop for stocks, especially since 1942
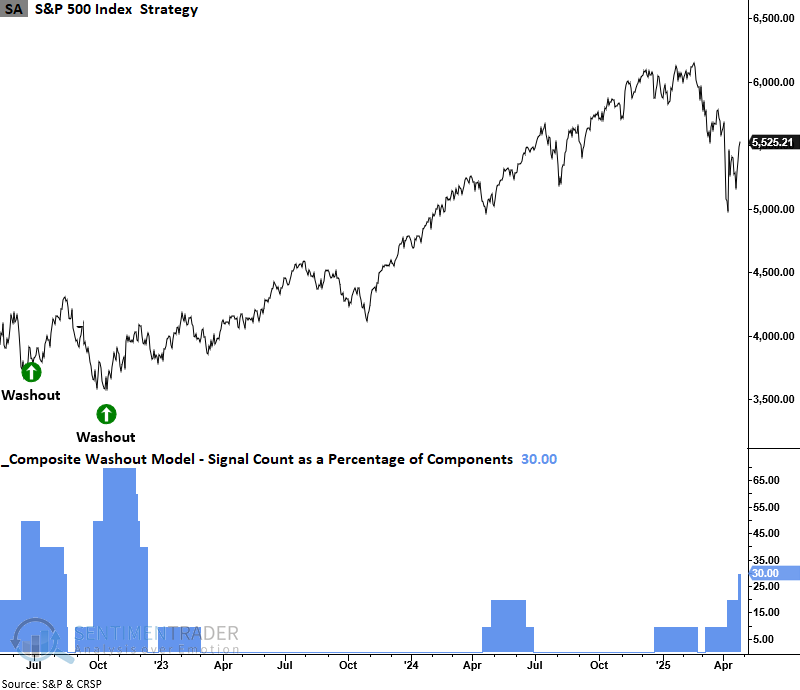
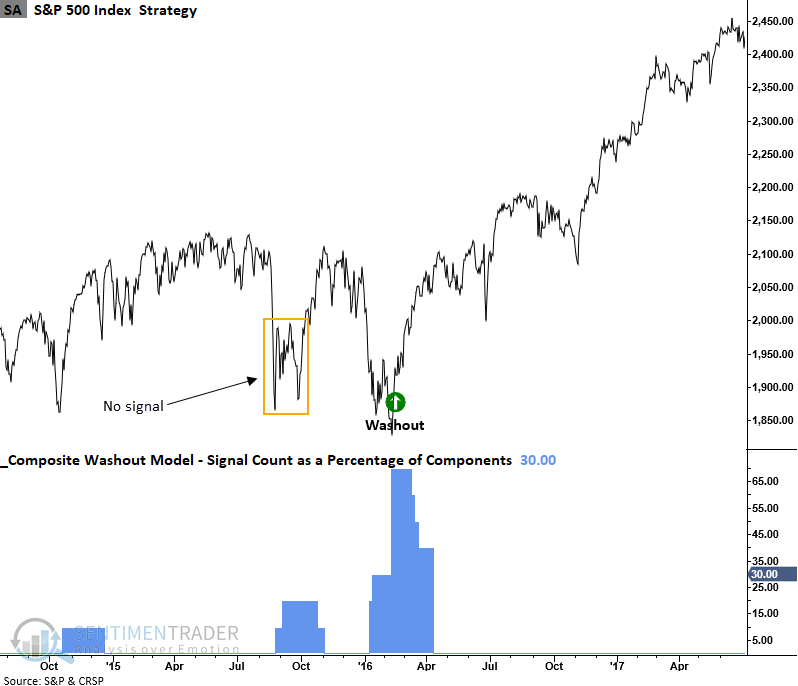
- The TCTM Composite Washout Model signal count increased to 30%
A contraction in volatility eventually leads to a more favorable environment for stocks
Over the past few weeks, we've highlighted several volatility-based indicators that spiked to extreme levels, typically associated with market bottoms. Now, these measures are reversing lower, suggesting fear is subsiding, a shift that tends to support a more favorable outlook for stocks over medium- and long-term horizons.
A TCTM Composite Washout Model component, which measures price volatility by calculating the absolute value of daily S&P 500 returns and smoothing it over ten days, surged to the 5th-highest level in over 80 years and subsequently dropped below 2%, triggering an alert.
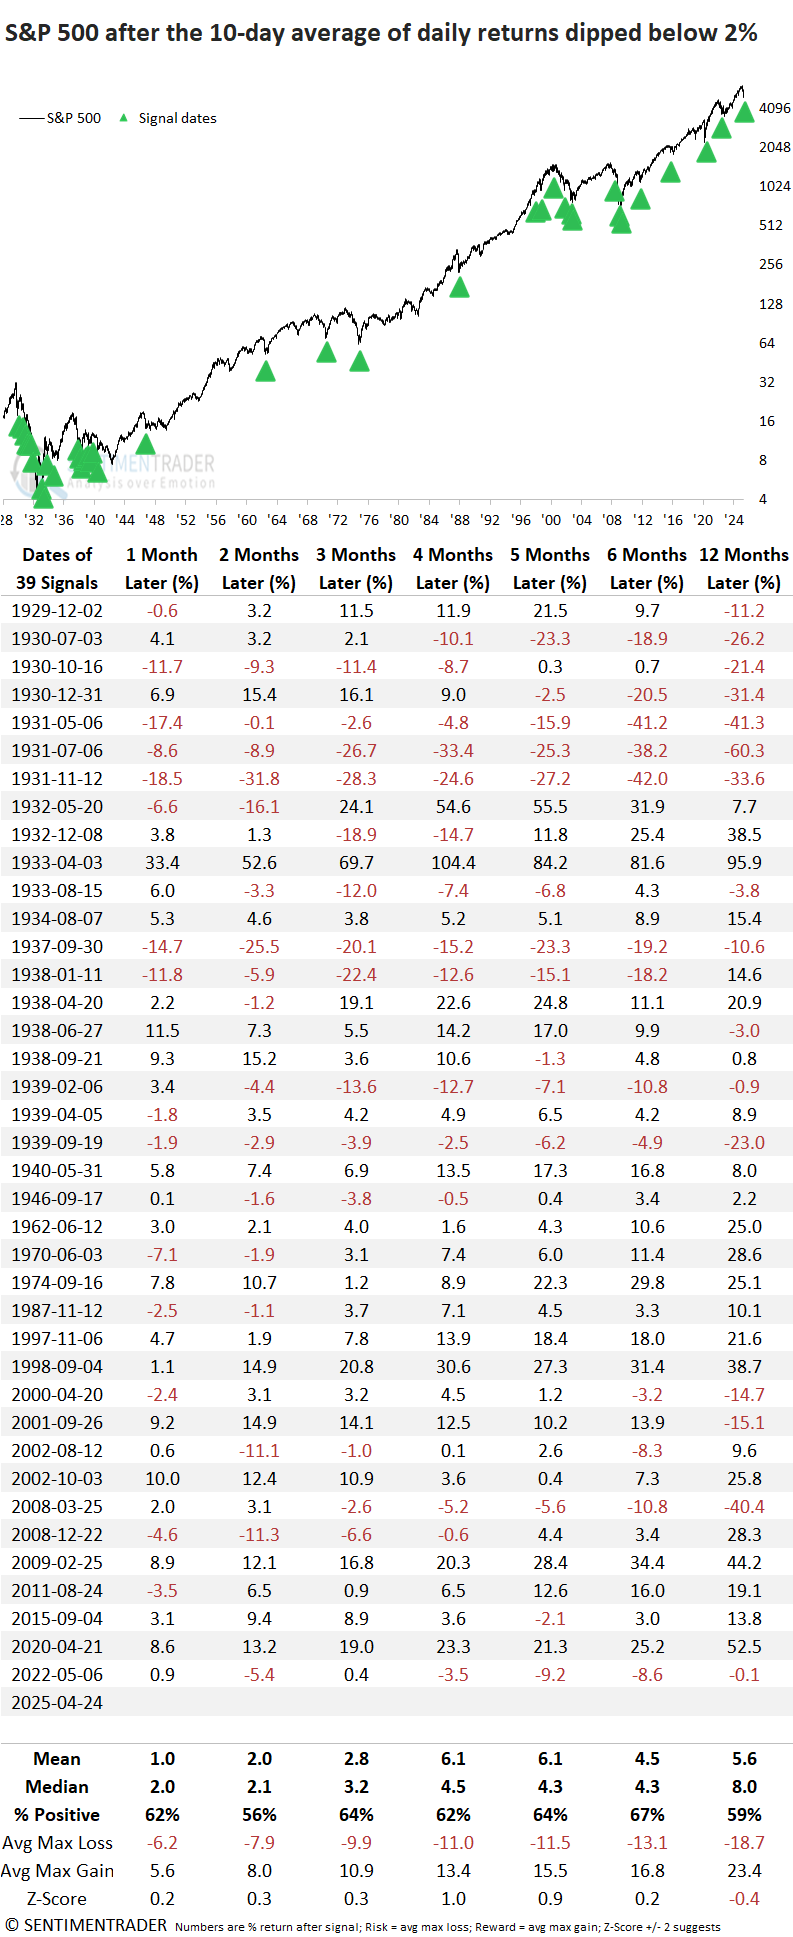
Similar contractions in volatility preceded a more constructive outlook for stocks
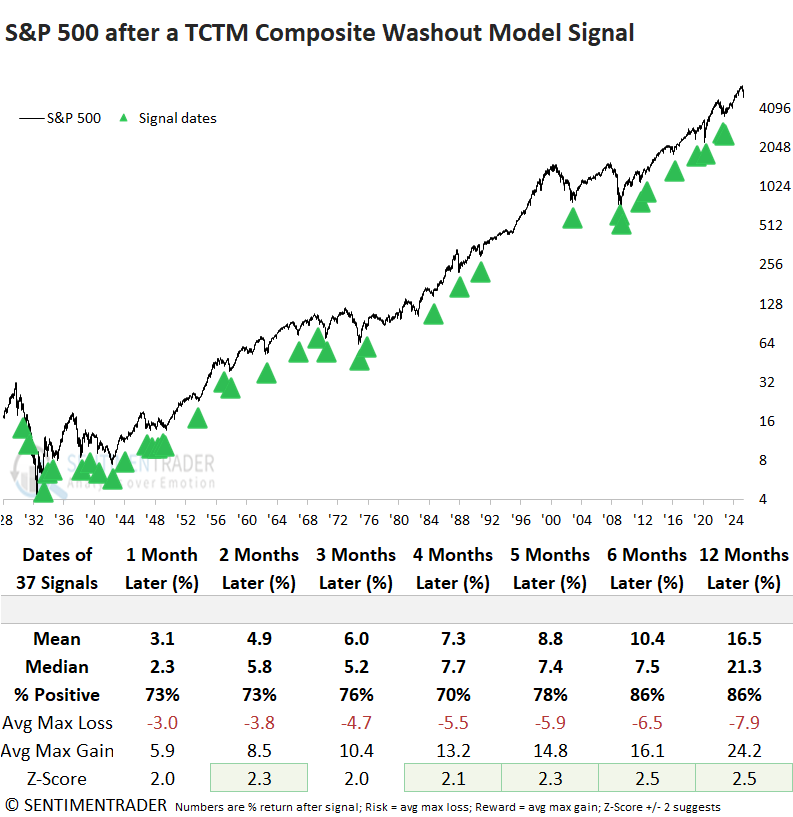
Whenever the absolute value of S&P 500's daily returns, smoothed by a 10-day average, rose above 2% and then dipped below that threshold, returns and win rates for the world's most benchmarked index were generally positive, though not emphatically bullish. Precedents from the challenging 1929-1942 secular bear market largely tempered the outcome. Recent instances, however, have produced a more encouraging trend.
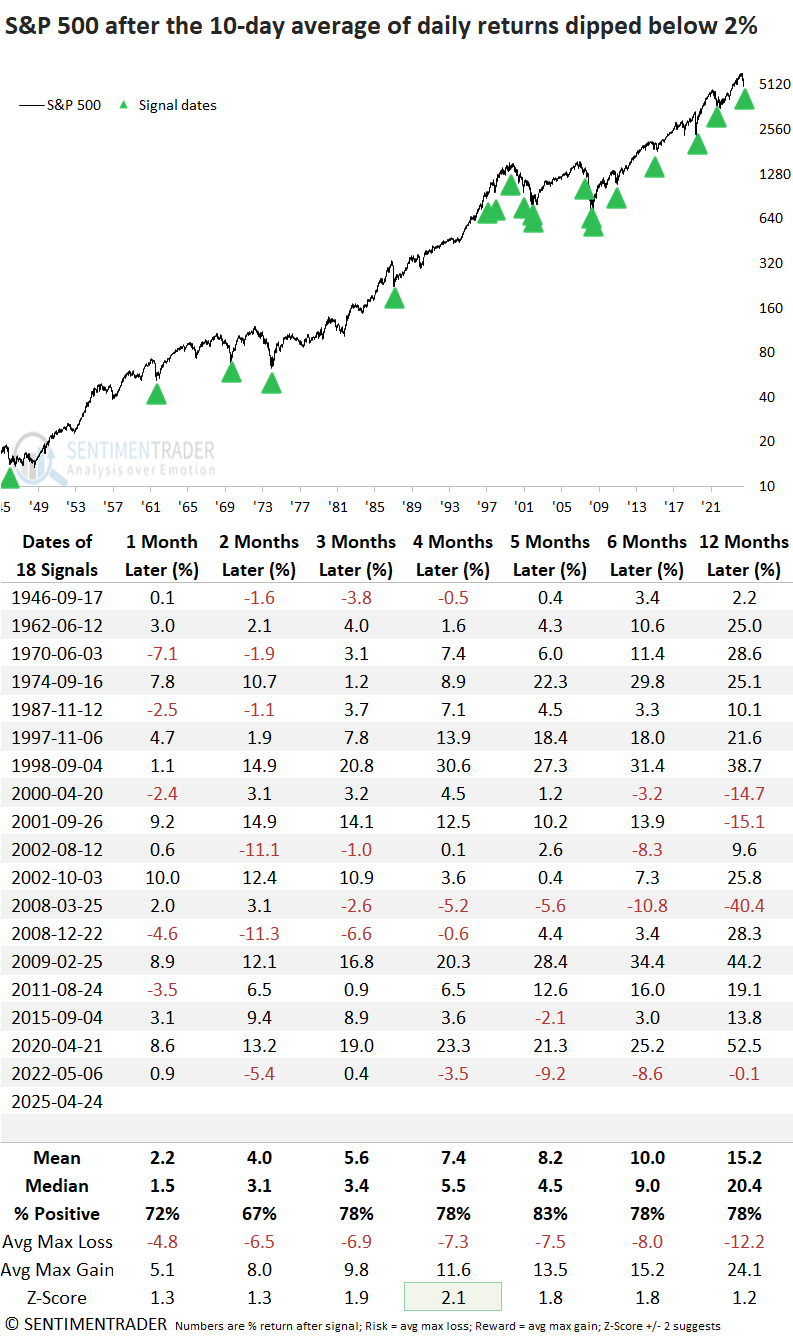
Post the 1929-42 secular bear market period, a contraction in daily return volatility led to performance and consistency that surpassed historical averages across all study periods, ranging from one to twelve months. While only the four-month window showed statistical significance, several others came close to it.
TCTM Composite Washout Model
Following the new component alert, the washout model's signal count climbed to 30%. Given the recent rally and because several components require a divergence, a composite signal would only emerge if the S&P 500 revisits the April 8 low, with fewer stocks making new lows or registering an oversold condition.
Interestingly, a washout signal did not materialize during the initial decline of the 2015-2016 growth scare correction. As previously cited, this period could serve as a potential analog for 2025. However, it remains crucial to stay flexible as new information becomes available.
Should a washout signal occur, the S&P 500 appears much more attractive, as the weight-of-the-evidence approach offers a more favorable outlook than any single component in the composite, particularly the volatility indicator discussed in today's note.
What the research tells us...
A TCTM Composite Washout Model component triggered a new alert as the 10-day average of daily S&P 500 returns fell below 2%, suggesting that extreme price volatility has eased. Historically, similar signals have been positive but not consistently "fat pitch" buy opportunities. However, alerts since 1942 have shown much stronger results. This highlights the importance of relying on a weight-of-the-evidence approach, a key strength of the composite washout model.