
Volatility shifts lower as buying pressure dominates the last hour

Key points:
- The Volatility Index (VIX) closed below 14 for the first time following an increase above 20
- Comparable shifts in expected volatility produced excellent returns and consistency for the S&P 500
- Over the last two weeks, consistent buying pressure has characterized the final trading hour
- The S&P 500 rose 90% of the time over the next six months following similar periods of buying pressure
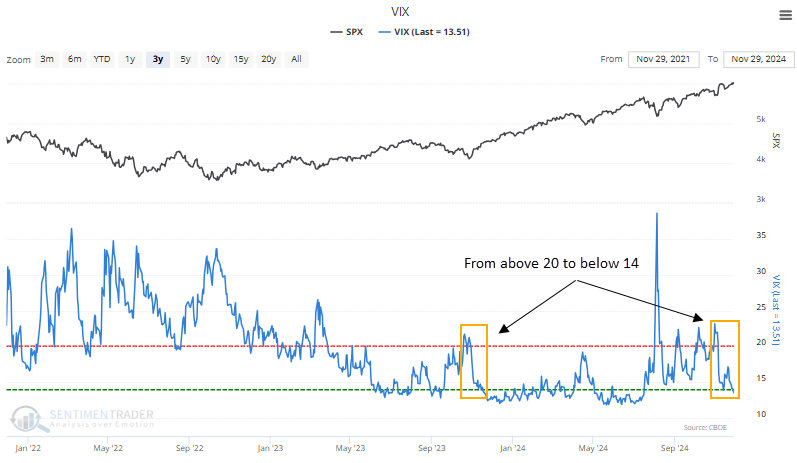
Expected volatility reversed to the downside, suggesting less uncertainty
The CBOE calculates a volatility index for the S&P 500, commonly known as the VIX or fear gauge. It measures market expectations of near-term volatility (1 month) conveyed by index option prices. The VIX rises when investors are uncertain or fearful about a market's direction. Conversely, when apprehension subsides, volatility reverts lower.
Following a significant surge in volatility over the summer, which saw the fear gauge rise to an intraday high of 65, the VIX settled into a range between 14 and 23 as several market-moving events, like the election, kept expected volatility elevated. However, with these events in the rearview mirror, the VIX closed below 14 for the first time last week, following an increase above 20.
The previous regime shift in expected volatility from above 20 to below 14 occurred in the fall of 2023, leading to a 10% gain in the S&P 500 over the subsequent three months.
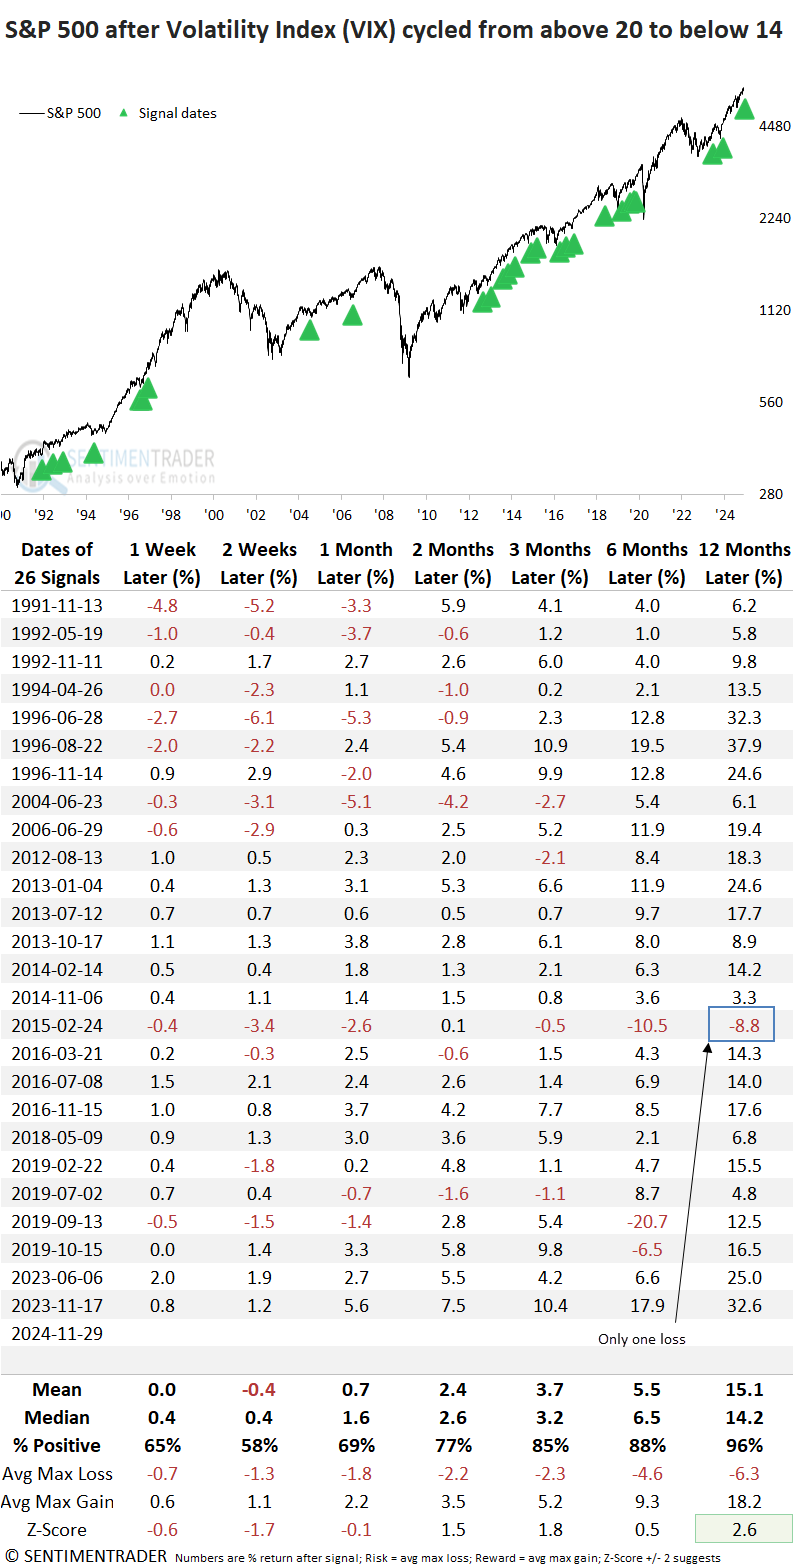
 Similar reversals in expected volatility preceded a bullish outlook for the S&P 500
Whenever the Volatility Index (VIX) cycled from above 20 to below 14, the S&P 500 displayed excellent returns and consistency over medium and long-term horizons. That was especially the case a year later, as the world's most benchmarked index rose in all but one instance and exhibited significance compared to random returns over the study period.
Interestingly, one precedent occurred following the 2016 election. In that instance, the S&P 500 rallied until mid-December and remained range-bound for six weeks.
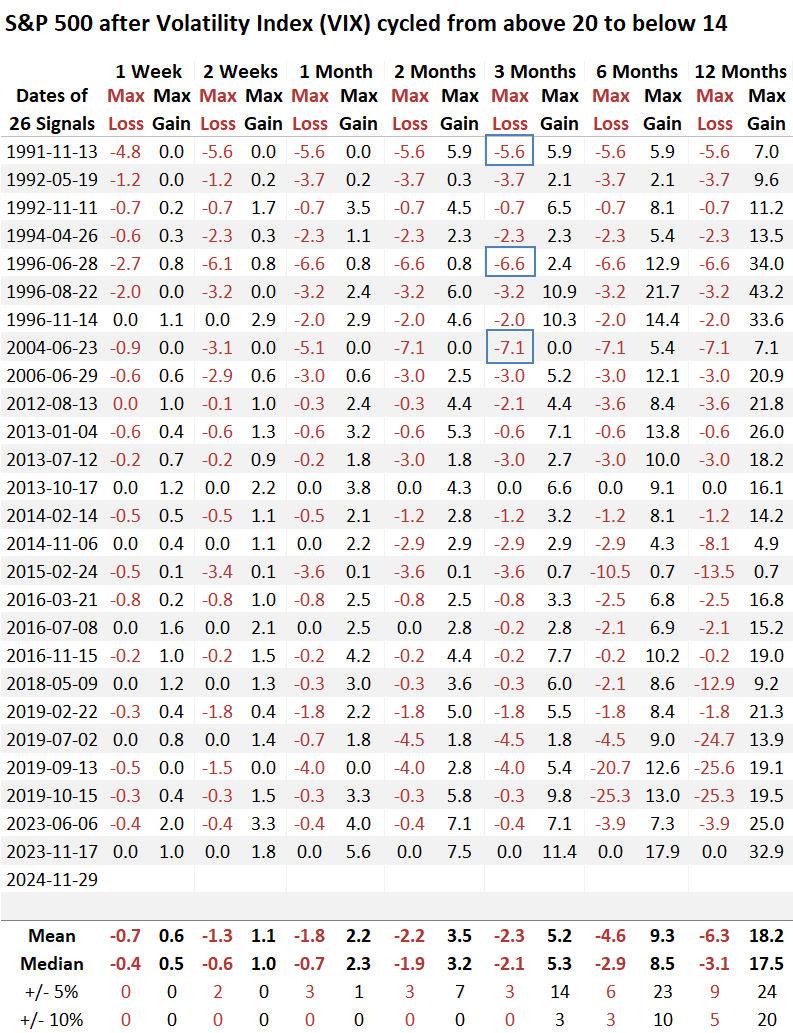
Over the subsequent three months, three precedents saw a maximum loss surpassing 5%, with the last instance occurring in 2004. Moreover, a 10% or greater decline was observed only at the six-month mark.
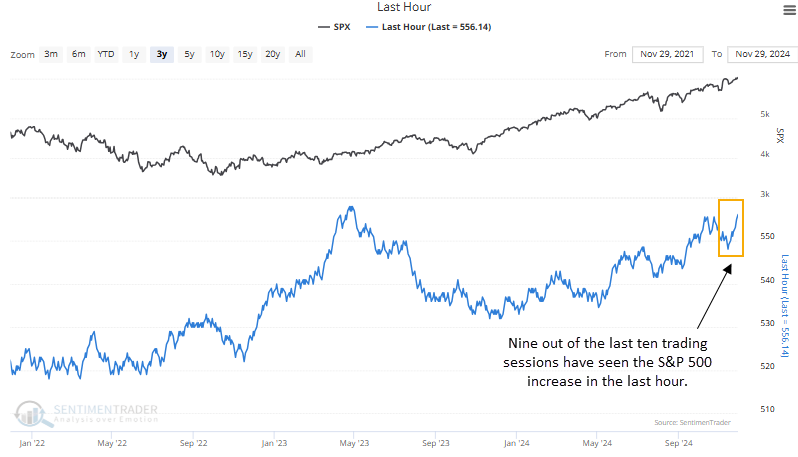
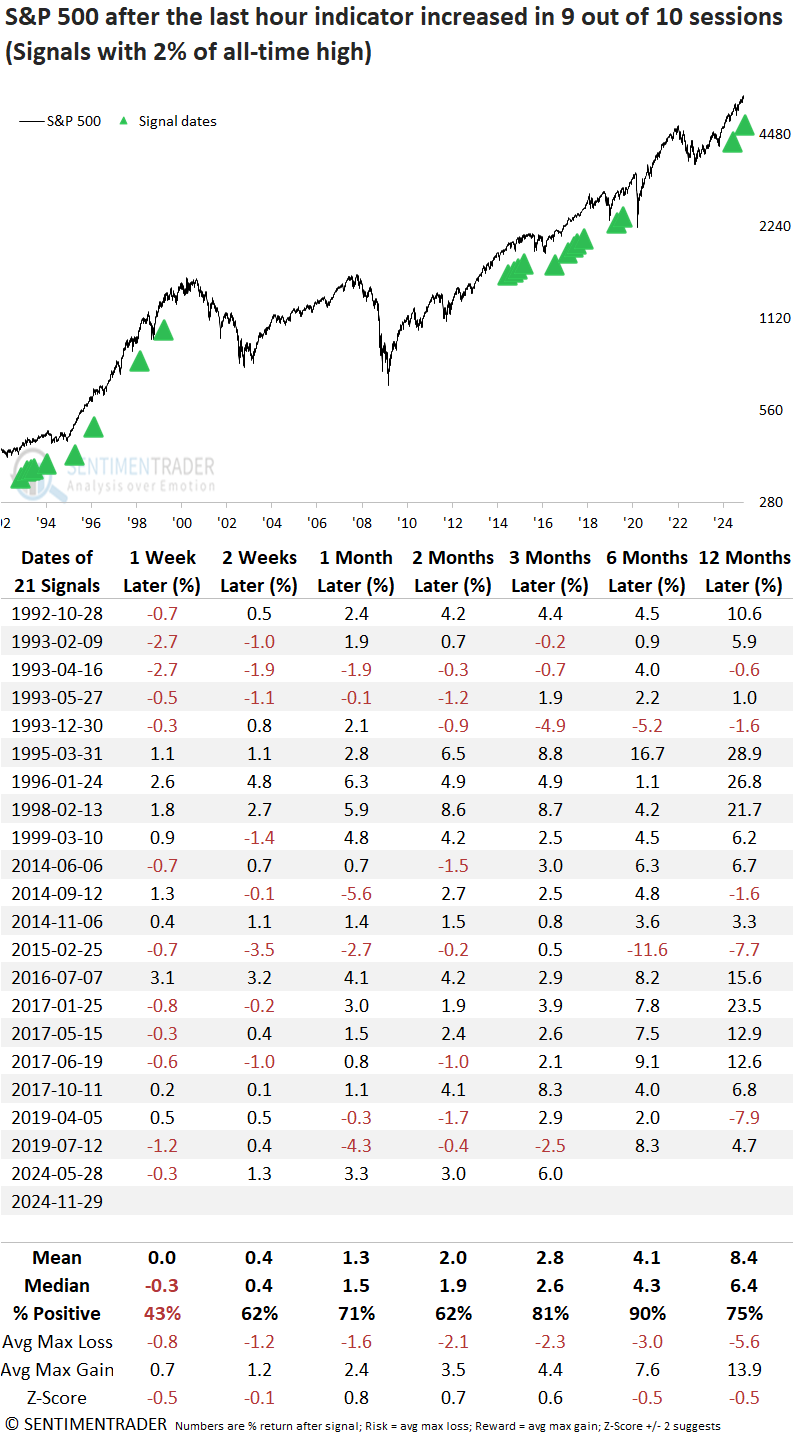
Buying pressure dominates the last hour of trading
The last-hour indicator tracks the cumulative direction of the final hour of trading for the S&P 500, revealing whether buying or selling pressure dominates this pivotal trading window.
In nine of the last ten sessions, the last-hour indicator has posted gains, signaling robust buying pressure as traders rush to complete orders, wary of the upward drift that frequently characterizes rising markets.
Similar bursts in buying pressure preceded positive returns for the S&P 500
Whenever the last-hour indicator climbed in nine out of ten sessions, and the S&P 500 hovered within 2% of its all-time high, the world's most benchmarked index advanced 90% of the time over the following six months. Although the three-month timeframe yielded less favorable results, it's notable that it recorded 14 consecutive gains starting in 1995.
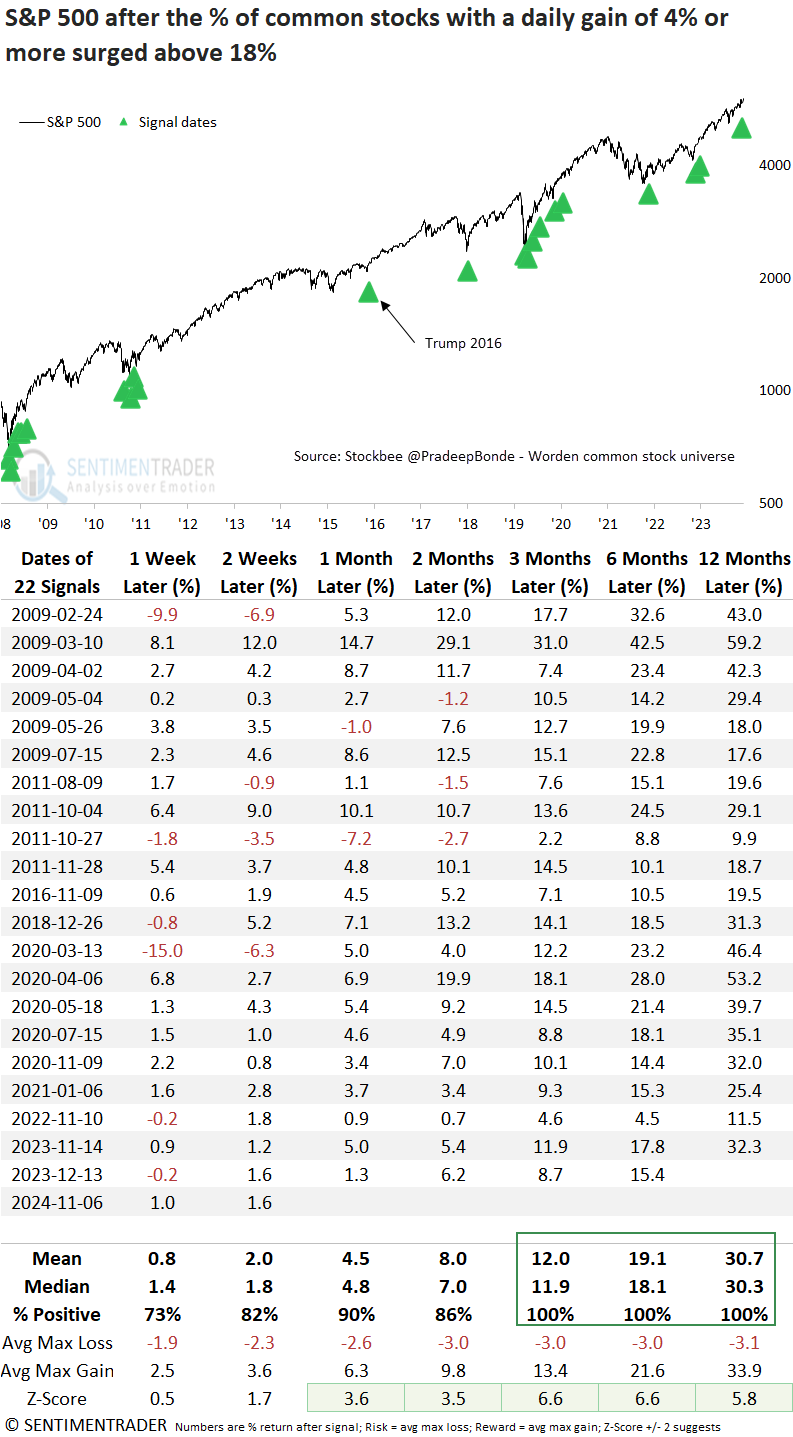
2016 election analog
Following the 2024 election results, stocks exploded higher, triggering a thrust signal when more than 18% of common stocks in a universe of over 6100 issues registered a daily gain of 4% or more. Like the contraction in expected volatility, this scenario also generated an alert in 2016, providing traders with a similar analog suggesting equity markets could move higher in the year ahead.
What the research tells us...
The fear gauge cycled from above 20 to below 14, signaling a regime shift in expected volatility, typically associated with risk-taking. Similar reversals in volatility have been bullish for equities, with the S&P 500 advancing a year later in all but one instance. Adding to the bullish backdrop, the "last hour" indicator-a gauge of institutional activity-has risen in nine of the past ten sessions, reflecting consistent buying pressure during this critical period. Together, these dynamics suggest a constructive environment for stocks, with several measures aligning with the 2016 election analog. For now, the weight of the evidence continues to favor the bulls, notwithstanding the typical gyrations associated with uptrends.