
Vietnam - The best house in a bad emerging market neighborhood

The absolute and relative trends for most emerging market countries have deteriorated for the last couple of months as the dollar's counter-trend rally has put pressure on the group. As you know, my style of investing falls in the momentum/trend following camp. I want to own stocks or ETFs that exhibit strong absolute and relative trends. When I survey the EM landscape with my trend-following techniques, I find very few opportunities on a country-by-country allocation basis. That's not to say that one can't find opportunities in single stocks within a specific country.
Vietnam is one bright spot in a sea of negative trends that looks interesting to me. I include Vietnam in the EM space, even though some might consider it a frontier country.
Let's review several charts and tables to see what stands out with my absolute and relative trend-following indicators.
Data as of 4/13/21 close.
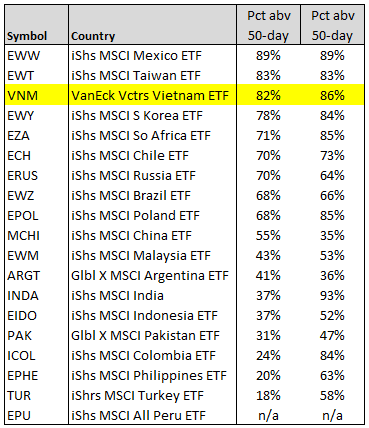
Absolute High Table
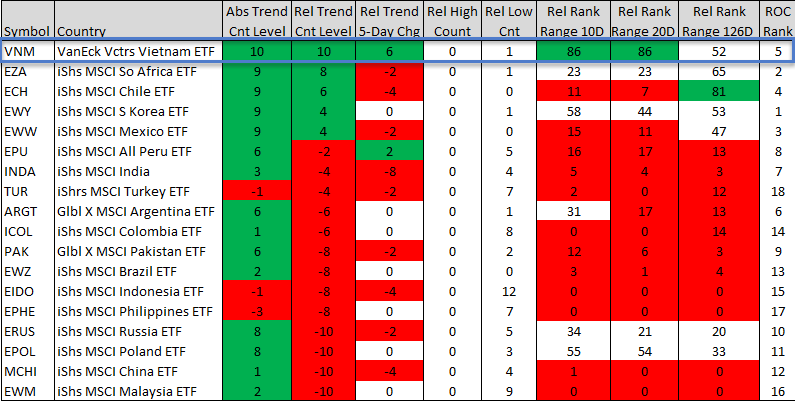
As one can see, Vietnam registered a new 252-day high on Tuesday. I would also note that Chile, Taiwan, Mexico, and South Africa all remain within five days of a 252-day high. As far as the rest of the EM countries, the last two columns highlight how several ETFs remain well below the previous peak in terms of duration and percentage terms.

Absolute and Relative Trend Table (Relative Trends vs. S&P 500)
Vietnam is the only country to maintain an absolute and relative trend model score of 10. I would also note that the relative trend score has jumped six points in the last week. While Vietnam registered a 42-day low versus the S&P 500 in the previous 15 days, I would note that it occurred during a consolidation phase. Now that the bull trend has resumed, let's see if it can make some new relative highs. If we look at the other ETFs, Peru is the only other country to show an increase in the relative trend score over a trailing 5-day period. The relative trend score for India shows a notable decline of 8 points. In terms of the relative low count column, Indonesia has registered 12 relative lows versus the S&P 500 in the last 15 days using a duration lookback of 42 days. As a group, EM looks weak across several indicators.
Column Definitions
1.) Absolute Trend Count Level - The absolute trend model contains ten indicators to assess trends across several durations.
2.) Relative Trend Count Level - The relative trend model contains ten indicators to assess trends across several durations. Relative to S&P 500.
Trend models are 10 (best) to -10 (worst).
3.) Relative Trend 5-Day Change - This indicator measures the 5-day net change in the relative trend model.
4.) Relative High Count - This indicator measures the number of 42-day relative highs versus the S&P 500 in the last 15 days.
5.) Relative Low Count - This indicator measures the number of 42-day relative lows versus the S&P 500 in the last 15 days.
6.) Relative Rank Range 10-Day - This indicator measures the ratio range in percentage terms for a country versus the S&P 500 over the last ten days. 100 (Highest) 0 (Lowest). I use the same method for the 20 and 126-day versions.
7.) ROC Rank - This indicator ranks each country using a weighted rate of change methodology. i.e., similar to IBD rankings.
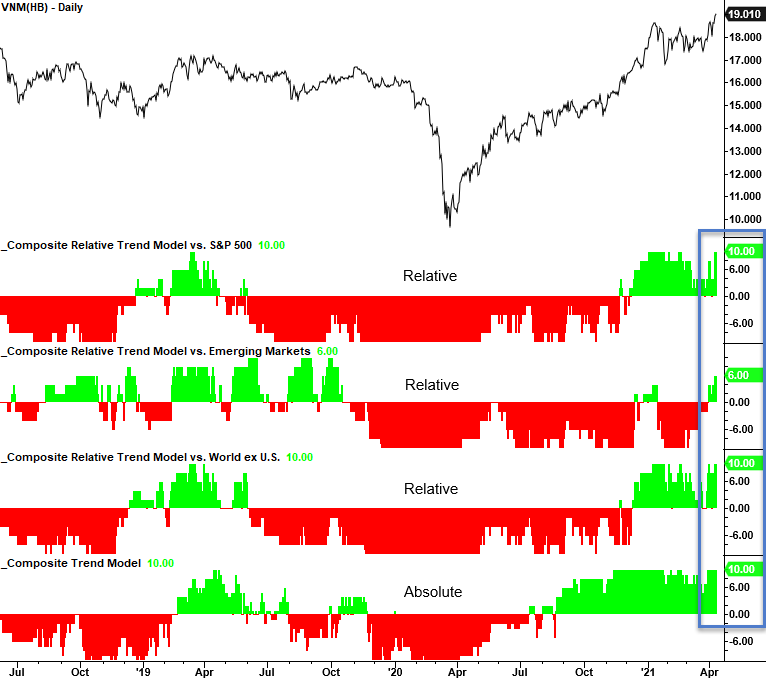
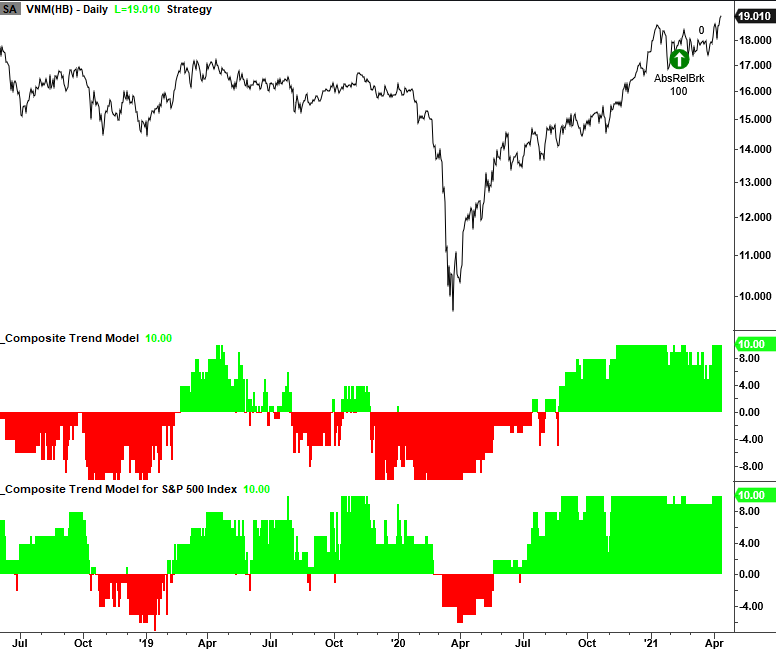
Absolute and Relative Trend Model Chart
The following chart shows that Vietnam maintains a positive relative trend score count of 10, 6, and 10 when measured versus the S&P 500, emerging markets, and the world ex U.S. I would note that the relative trend score versus emerging markets has increased to the highest level since October 2019.
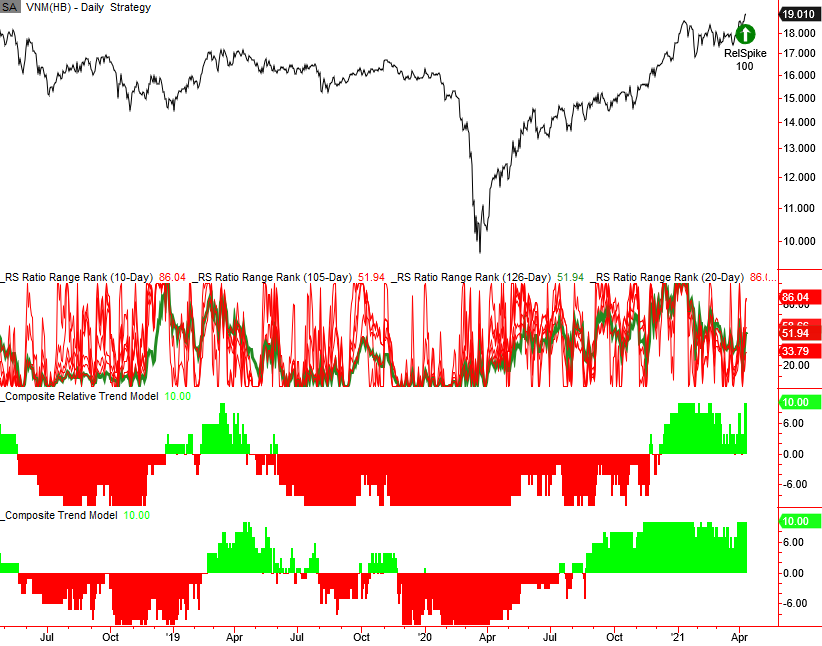
The following three charts contain some absolute and relative swing trading algorithms that suggest that the bullish uptrend in Vietnam should continue.
Relative Surge
Intermediate-Term Swing Trade Breakout
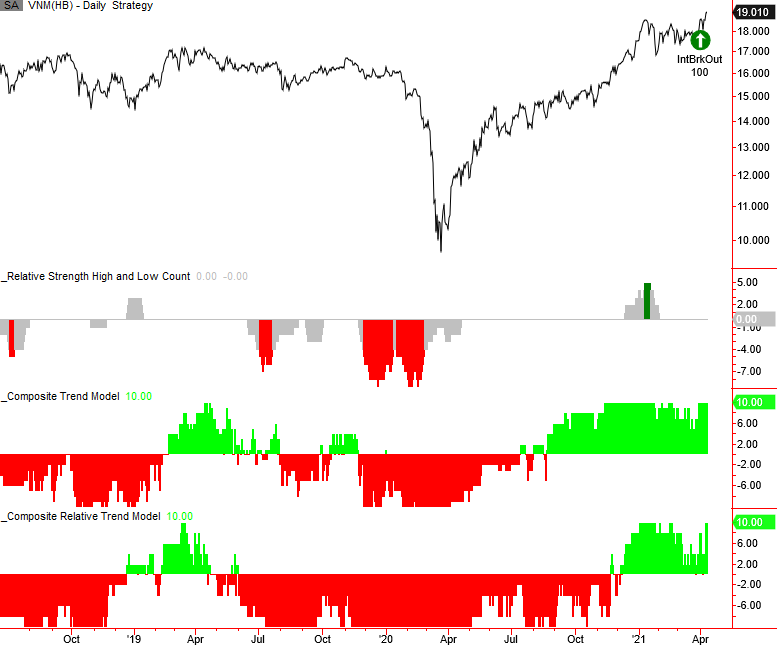
Absolute and Relative Breakout
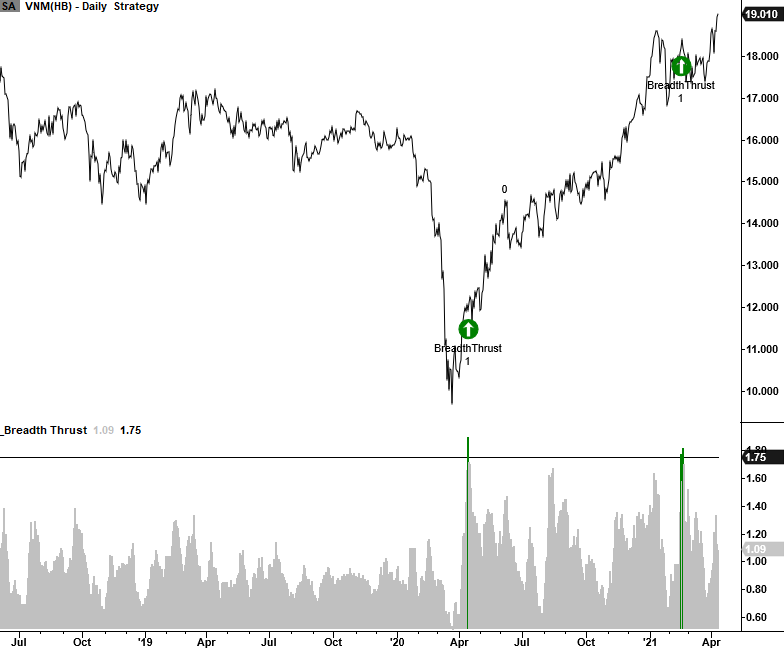
Breadth Thrust
I always like to assess internal participation, and Vietnam looks good with a recent breadth thrust buy signal.
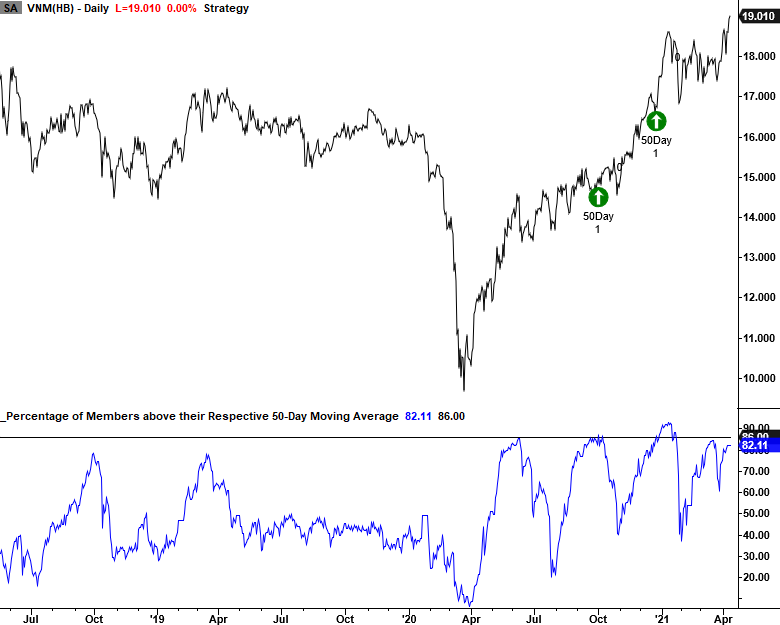
Percentage of Issues above the 50 and 200-Day Moving Average
Internal trends as measured by the percentage of issues above the 50 and 200-day moving average look good for Vietnam.
Source: Bloomberg
Conclusion: Vietnam is a shining light in an otherwise weak environment for emerging market countries as measured by absolute and relative trends. I would keep an eye on South Africa, Chile, South Korea, and Mexico as the relative trends versus the S&P 500 have weakened of late. As always, I will be keeping an eye on the Dollar Index.