
Vietnam - A Spike in New Lows

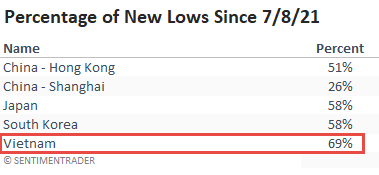
The alarm bells are ringing in southeast Asia. Since last Thursday, several vital countries from a manufacturing perspective have seen a sizable spike in 21-day lows. In a note on Monday, Jason noted the increase in new lows for Kospi members on 7/9/21. And, as of the close of trading on 7/12/21, the Vietnamese stock market joined the party with a substantial increase in new lows to 69%.
Suppose you've had a chance to read one of my absolute and relative trend update notes of late. In that case, you will know that Vietnam has been one of a handful of countries with favorable relative trends compared to the S&P 500. That is, of course, until the last few days.
Let's conduct a study to assess if Vietnam can return to its leadership status by evaluating the outlook when the percentage of members registering a 21-day low increase above 60%. The threshold level of 60% should help us to judge more instances. I will also use a 1-month holding period to screen out duplicate signals.
The significant spike in new lows around Asia occurs as the S&P 500 is registering new all-time highs.
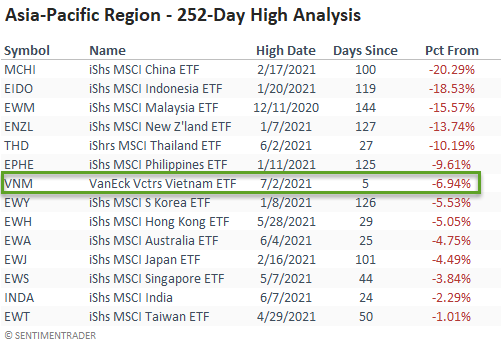
The following table highlights how Vietnam has been a standout in the region until the last few days.
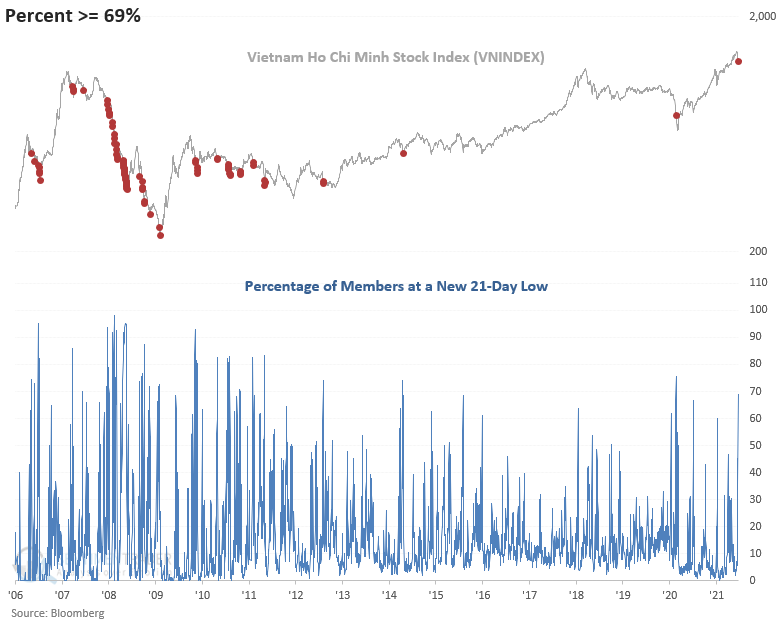
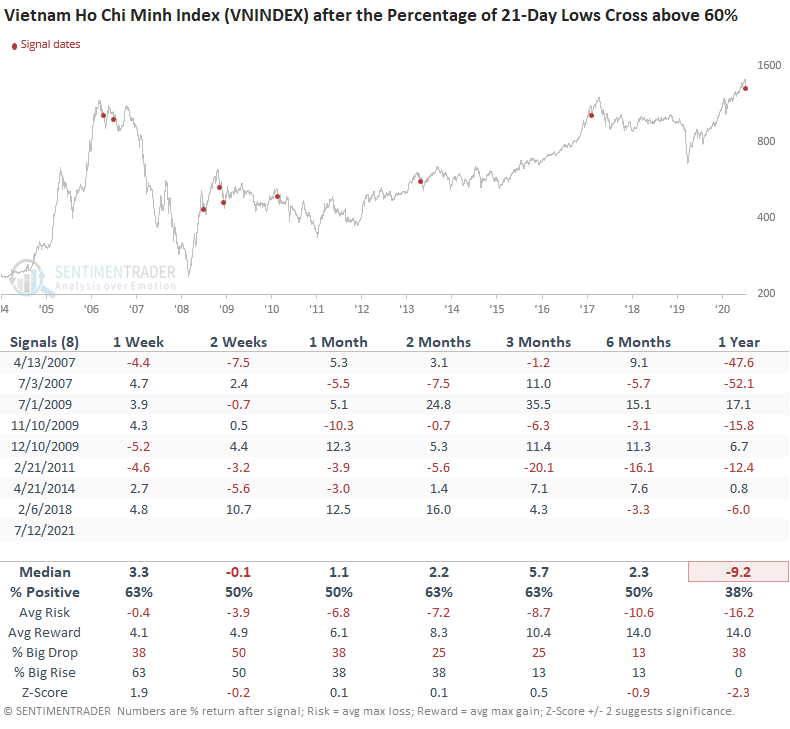
HISTORICAL CHART
The historical chart highlights the extreme nature of the increase in new lows. Typically, the phenomenon occurs during bear markets.
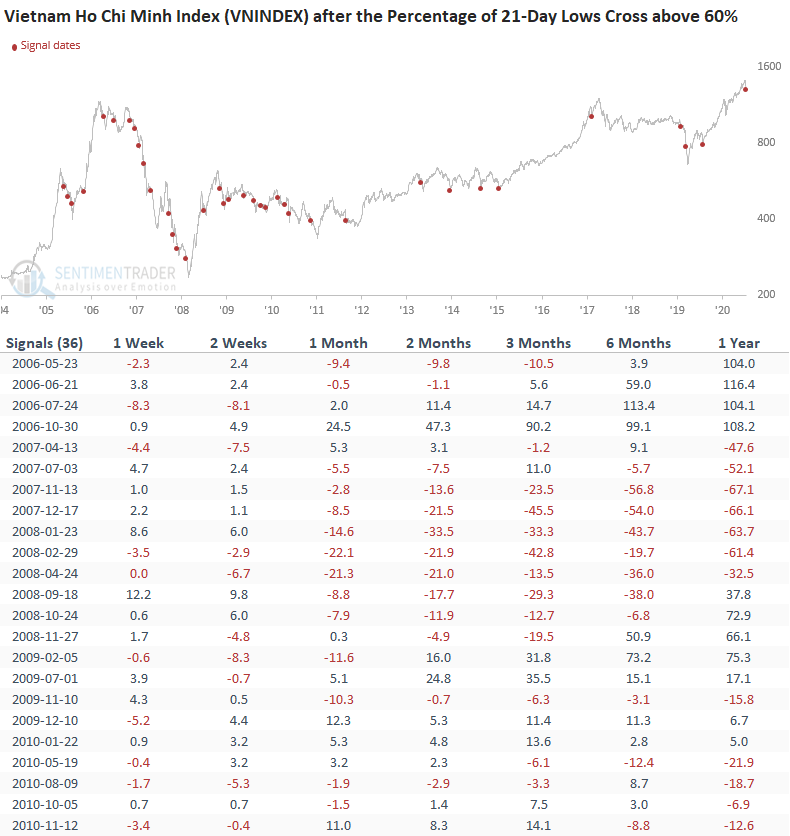
HOW THE SIGNALS PERFORMED
The 1-2 week results suggest that a small window of opportunity exists for a mean reversion bounce. And, while the 1-3 month timeframe is uninspiring, I would note that more recent signals have been better.
Let's add a trend filter to the study. We will now look for all instances when the Vietnam Stock Index is trading above its 200-day moving average, and new lows as a percentage of members spike above 60%.
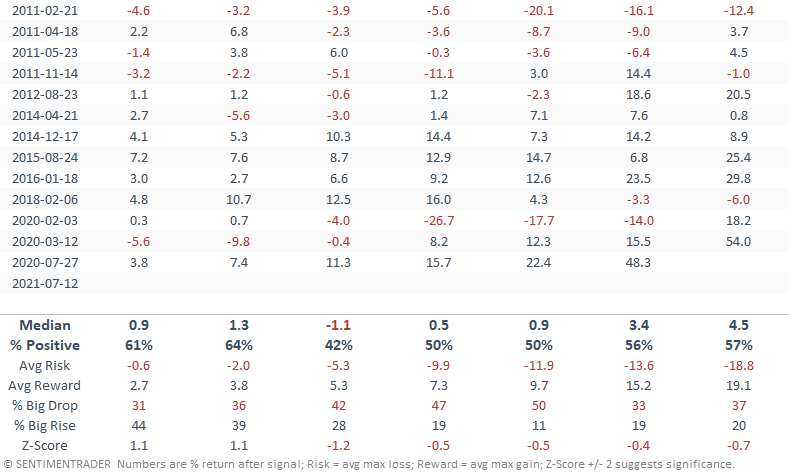
HOW THE SIGNALS PERFORMED WITH FILTER
Surprisingly, the trend filter results look mundane across almost all timeframes. Typically, they would look better as the filter tends to screen out unprofitable signals during bear markets. The 1-year window is noteworthy.
The sharp decline in the last five days has been alarming, and the study results are not compelling enough for me to play a mean-reversion bounce. Therefore, I will wait for my momentum reversal models to trigger an alert that should provide a better risk/reward profile.