
Utility uptrends vastly outnumber staples

Key points:
- Utility stock uptrends have vastly outnumbered those for staples, a fellow defensive sector
- There is an unusually wide spread between uptrends in the two sectors relative to the past 30 years
- It has not been a particularly worrisome sign for the broader market, though longer-term there was some mean-reversion
Utility uptrends vastly outnumber staples
Defensive stocks get their name from their tendency to serve as semi-safe havens during economic distress. No matter how bad things get, people still need to power their homes, attend to basic health care, and buy ingredients to make food at home. Because of these tendencies, utilities, health care, and consumer staples stocks often buffer against losses during protracted downturns.
Also, because of these tendencies, they tend to travel together more or less. Of course, they all have their quirks, but generally, they ebb and flow in the same broad directions. However, that hasn't been the case lately with a couple of them.
Almost all utility stocks are holding above their medium-term trends, while relatively few staples are doing so. As of last week, more than 93% of utilities were trading above their 50-day moving averages.
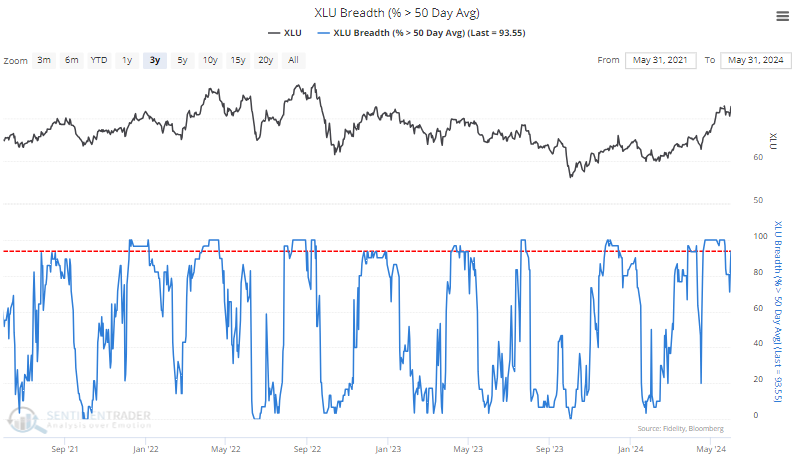
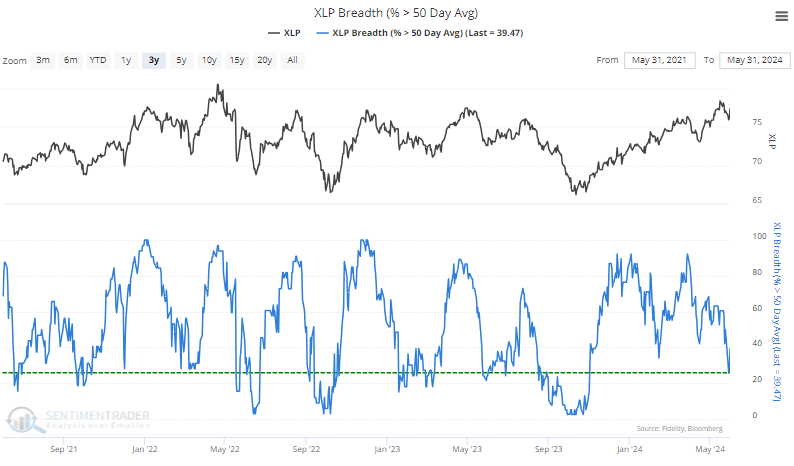
Around the same time, fewer than 30% of staples were trading above their 50-day averages before a late rally on Friday.
Historically, a spread of more than 55% in the percentage of utility stocks above their 50-day averages minus staples above their averages is very wide. Over the past 30 years, it has happened fewer than 20 times.
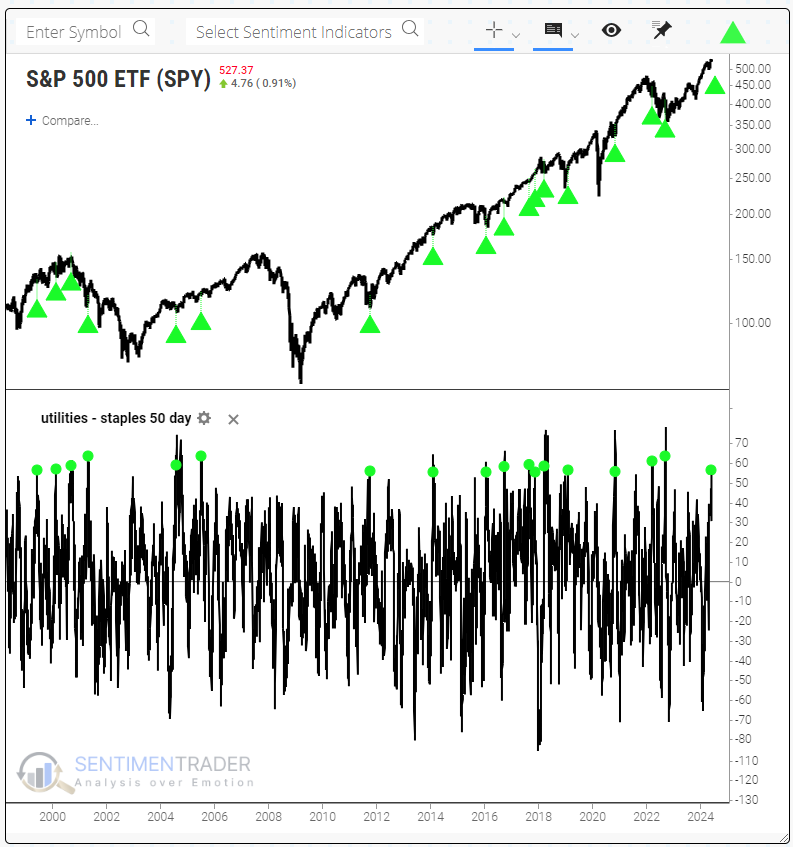
For this test, we'll require that the spread drops below zero to reset the conditions so we don't get multiple signals in a cluster that skew the forward returns.
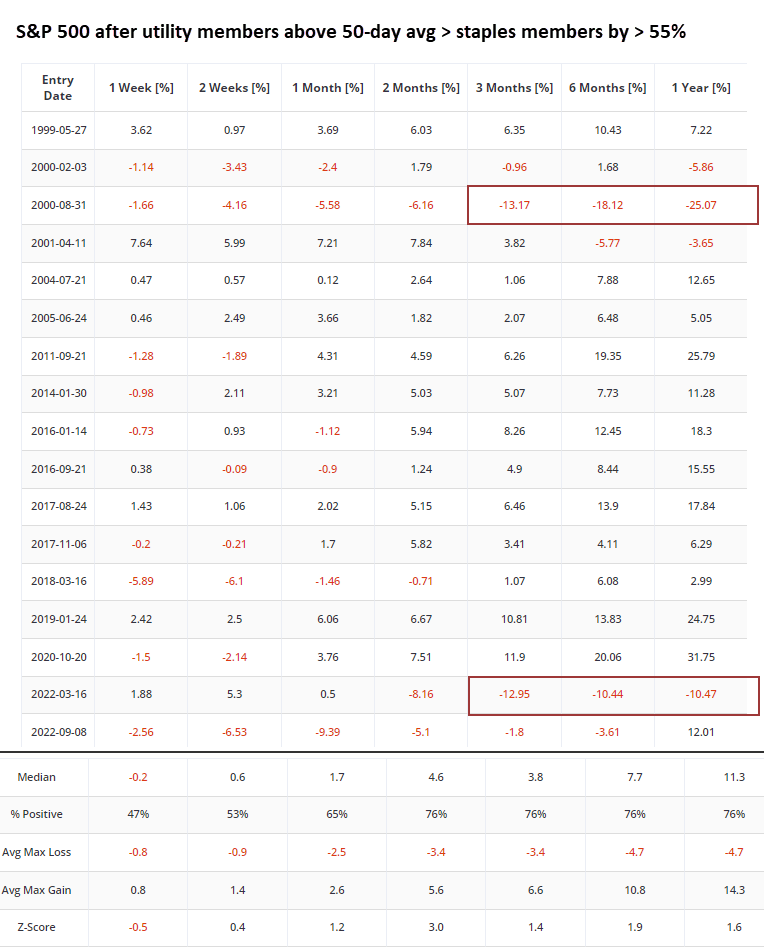
Not a bad sign for stocks; some long-term mean-reversion
The table below shows that for the S&P 500, this was not a particularly troublesome sign. Over the next two months, the S&P rallied 76% of the time, with a compelling return of +4.6%, well above random. Returns after that were above average, but the consistency wasn't especially notable. There were a few significant losses, as this divergence between utilities and staples triggered as stocks peaked in 2000 and 2022.
Users of Backtest Engine 2.0 may notice a new tab, Major Sectors. It's a useful addition that allows you to see how the S&P's sectors performed after signals in the backtest.

For this particular one, we can see that over the next year, technology did well while staples and utilities both struggled a bit.
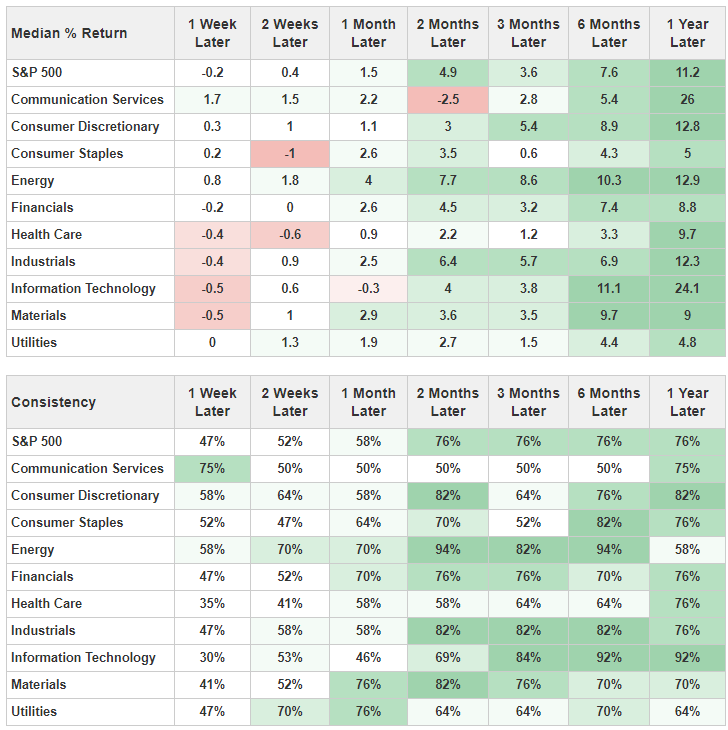
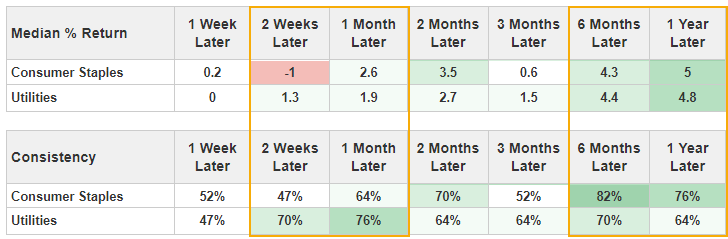
Focusing on those two sectors shows that utilities outperformed staples over the next 2-4 weeks, with a (mostly) higher average return and better consistency. However, staples outperformed over the next 6-12 months, especially in consistency.
Using the recently released My Indicator function, you can recreate this study or a nearly unlimited number of combinations.

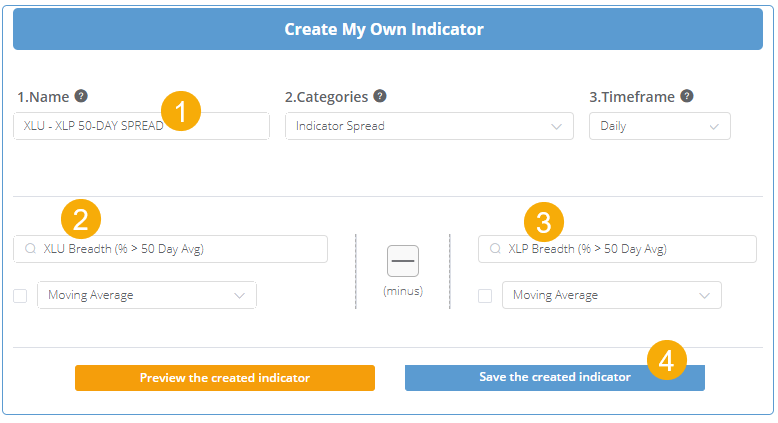
When you click that tab, you can then use virtually any two indicators in the database to create your own. For this test, all we need to do is:
- Name it whatever we want and leave (2) and (3) as the spread and daily defaults
- Start typing "xlu" and click XLU Breadth (% > 50 Day Avg) and leave "minus" as the function
- Type "xlp" and choose XLP Breadth (% > 50 Day Avg)
- Click the "Save the created indicator" button, and then we can use that in a backtest
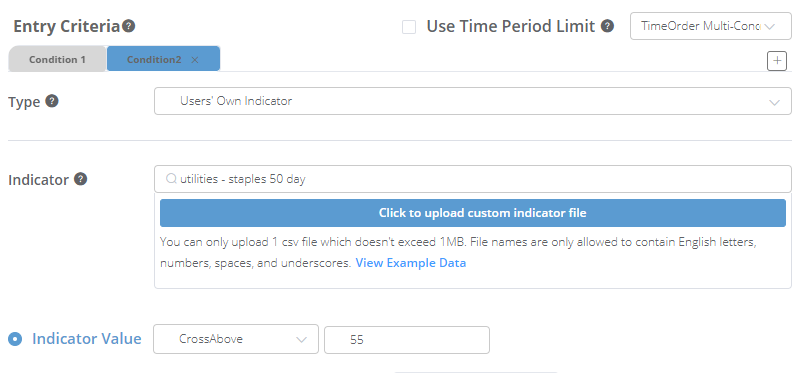
When using the backtest engine, we only need to select a Type of "Users' Own Indicator" and choose the one we just created in the Indicator box.
What the research tells us...
There have been an increasing number of warning signs in recent weeks, particularly on the Nasdaq exchange and among technology stocks. It might seem like another would be the jump in uptrends in utility stocks relative to others, even among other defensive sectors. That hasn't been the case, at least not consistently. There is also a "this time is different" vibe, given the demand for utility services to meet the power generation required for the dramatic uptick in the AI industry. Either way, this hasn't been a good reason to sell stocks in general. At most, it has been a modest sign that utilities may continue to better their staples counterparts for a few weeks. After that, the odds start to favor some mean-reversion.