Products
SentimenTrader Trading Tools
‍
Backtest Engine
My Trading Toolkit
Correlation Analysis
Seasonality
Market Prediction
Indicators & Data API
‍
Proprietary Indicators & Charts
Market Data API
Strategies & Scanner
‍
50+ Trading Strategies
Smart Stock Scanner
Smart Option Scanner
Research Reports
‍
Research Solutions
Reports Library
Free Resources
Simple Backtest Calculator
Simple Seasonality Calculator
The Kelly Criterion Calculator
Sentiment Geo Map
Public Research Reports
Education
Sentiment Indicators
Technical Indicators
Pricing
Company
About
In the News
Testimonials
Client Success Stories
Contact
Log inLoginSign up
< BACK TO ALL REPORTS

Utility stocks are crashing

Dean Christians
2022-10-07
Utility stocks are crashing, which triggered a surge in new lows last seen during the pandemic panic in March 2020. The negative momentum and expansion in new lows do not bode well for the utility sector or the S&P 500 in the next few months.

Key points:

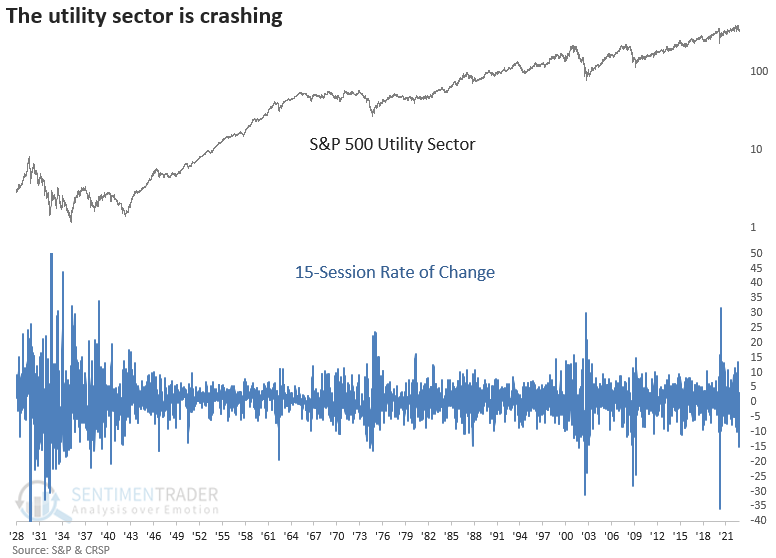
  • The S&P 500 utility sector declined 15% over the past 21 sessions 
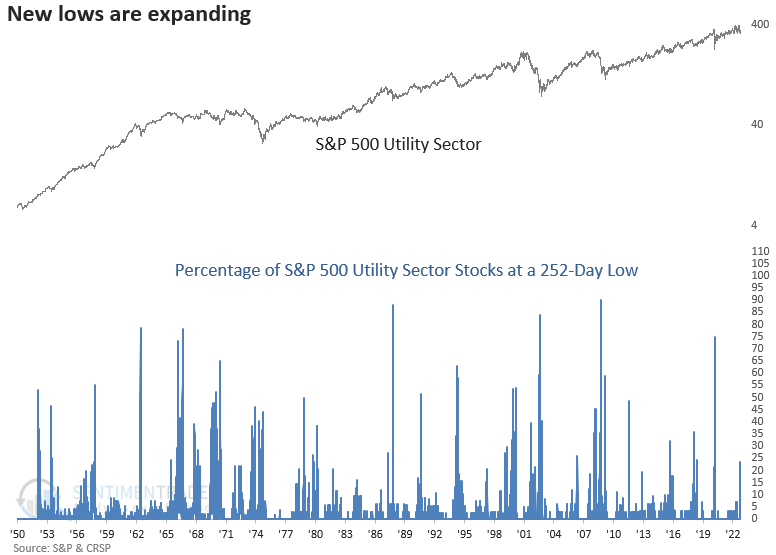
  • As a result, 252-day lows spiked to the highest level since the pandemic crash
  • After similar conditions, utilities and the S&P 500 struggled over the next few months

The last man standing joins the bear market party

The S&P 500 utility sector decided to join the bear market party, crashing 15% over the past 21 sessions. 

Historically, when investors panic and push the sell button on traditionally defensive groups, the broad market is one step closer to a potential bottom. However, the sector is less than 20 sessions from an all-time high. So, it's more likely that the momentum signal could be the start of something rather than the end.

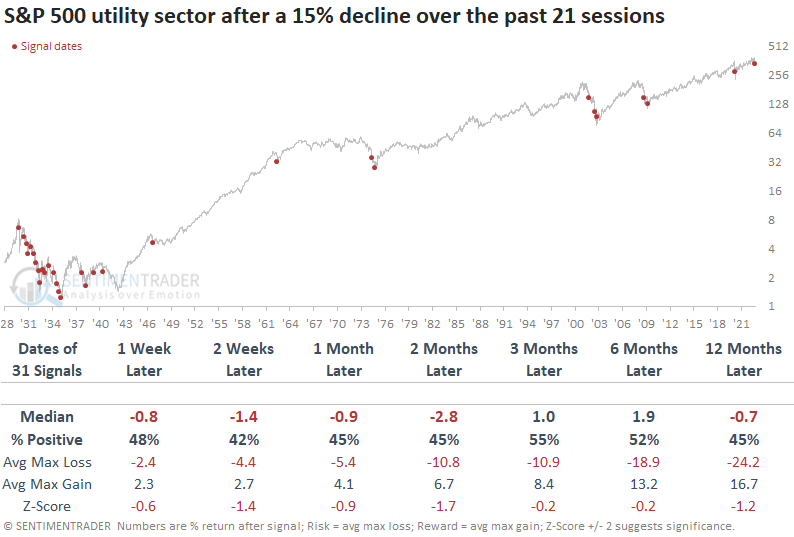
A swift decline in utilities preceded negative returns for the sector

The utility sector tends to decline further over the next few months after rapid contractions over a 21-session period. While the 1929-42 secular bear market dominates the signal count, 7 out of 9 alerts since 1962 were negative at some point in the first two weeks.

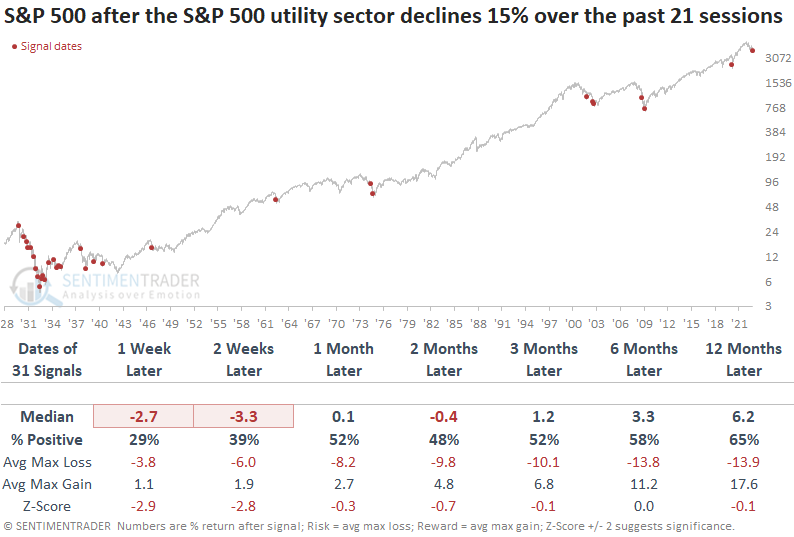
The S&P 500 fared even worse in the first few weeks, with weaker returns and win rates than utilities. Once again, more recent signals were unfavorable in the near term, with 8 out of 9 alerts showing a negative return.

New lows spike as utility stocks crash

The swift decline in utility stocks resulted in a surge in 252-day lows, which increased to the highest level since the pandemic crash. However, new lows remain well below other bear market levels. For example, they exceeded 80% in July 2002 and October 2008.

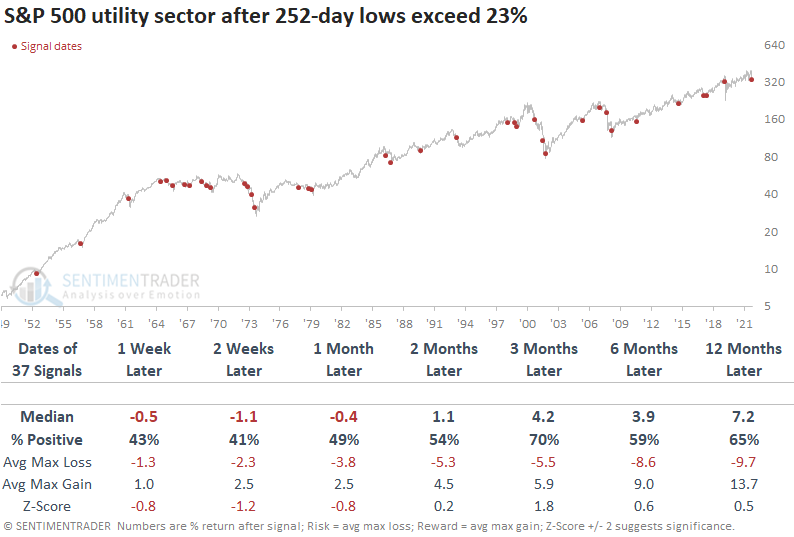
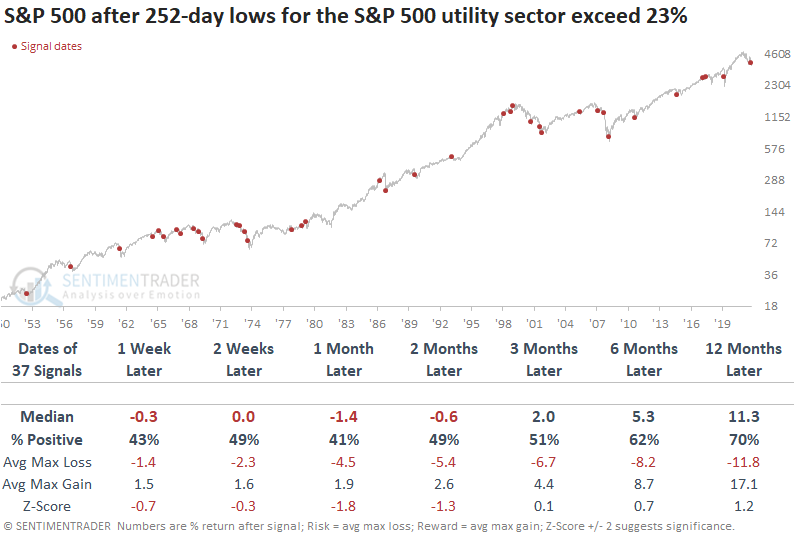
A surge in new lows preceded negative returns for the sector

The expansion in new lows for utility stocks does not bode well for the sector over the next month. Returns and win rates were unfavorable, especially during the inflationary 1970s period when bond yields marched higher.

The S&P 500 managed to perform a little worse than utilities after a spike in new lows, with negative returns over the next few months. Once again, alerts that were triggered in the 1970s performed poorly.

What the research tells us...

Defensive sectors are often the last groups to get taken to the woodshed in bear markets. The utility sector finally succumbed to the weight of rising bond yields by crashing over 15% in the last month, which triggered a spike in new lows. After similar conditions, utilities and the S&P 500 struggled over the next few months. 

PRODUCTS
SentimenTrader
Trading Tools
Indicators & Data API
‍
Strategies & Scanner
‍
Research Reports
FREE
RESOUrCES
Simple Backtest
Calculator
Simple Seasonality
Calculator
The Kelly Criterion
Calculator
Sentiment Geo Map
‍
Public Research Reports
‍
Education
Sentiment Indicators
‍
Technical Indicators
‍
Pricing
Bundle pricing
‍
FAQ
‍
Announcements
‍
COMPANY
‍
About
‍
In the News
‍
Testimonials
‍
Client Success Stories
CONTACT
‍
General Inquiries
‍
Media Inquiries
‍
Financial Professionals Inquiries
‍
© 2026 Sundial Capital Research Inc. All rights reserved.
Setsail Marketing
TermsPrivacyAffiliate Program
Risk Disclosure: The information and tools provided are for research and analytical purposes only and are not intended as investment advice. Market analysis involves uncertainty, and outcomes may differ from expectations. Users should conduct their own due diligence and consider their individual circumstances before making any financial decisions. Past performance is not necessarily indicative of future results.

Hypothetical Performance Disclosure: Hypothetical performance results have many inherent limitations, some of which are described below. No representation is being made that any account will or is likely to achieve profits or losses similar to those shown; in fact, there are frequently sharp differences between hypothetical performance results and the actual results subsequently achieved by any particular trading program. One of the limitations of hypothetical performance results is that they are generally prepared with the benefit of hindsight. In addition, hypothetical trading does not involve financial risk, and no hypothetical trading record can completely account for the impact of financial risk of actual trading. for example, the ability to withstand losses or to adhere to a particular trading program in spite of trading losses are material points which can also adversely affect actual trading results. There are numerous other factors related to the markets in general or to the implementation of any specific trading program which cannot be fully accounted for in the preparation of hypothetical performance results and all which can adversely affect trading results.

Testimonial Disclosure: Testimonials appearing on this website may not be representative of other clients or customers and is not a guarantee of future performance or success.