Products
SentimenTrader Trading Tools
‍
Backtest Engine
My Trading Toolkit
Correlation Analysis
Seasonality
Market Prediction
Indicators & Data API
‍
Proprietary Indicators & Charts
Market Data API
Strategies & Scanner
‍
50+ Trading Strategies
Smart Stock Scanner
Smart Option Scanner
Research Reports
‍
Research Solutions
Reports Library
Free Resources
Simple Backtest Calculator
Simple Seasonality Calculator
The Kelly Criterion Calculator
Sentiment Geo Map
Public Research Reports
Education
Sentiment Indicators
Technical Indicators
Pricing
Company
About
In the News
Testimonials
Client Success Stories
Contact
Log inLoginSign up
< BACK TO ALL REPORTS

Utilities trigger a risk-on buy signal for the broad market

Dean Christians
2023-11-14
A trading model that measures performance trends between the traditionally defensive utility sector and the S&P 500 generated a new buy signal. Similar shifts in investor behavior led to solid returns for the S&P 500 over medium and long-term horizons.

Key points:

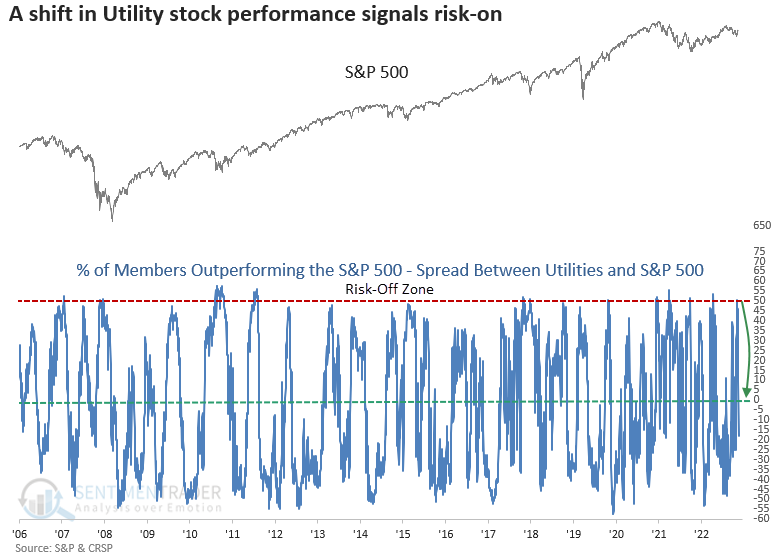
  • Utility stocks experienced a notable surge in outperformance, followed by a sudden and sharp collapse
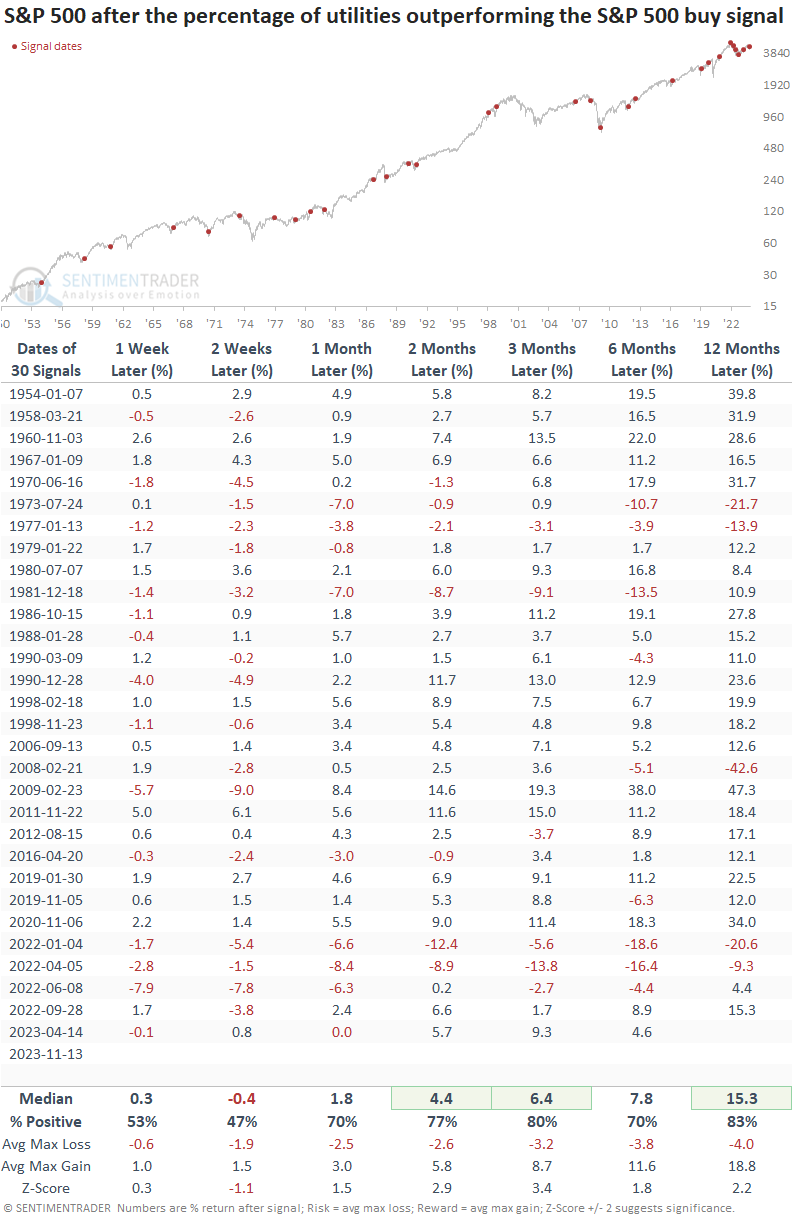
  • Similar shifts in relative performance produced solid returns for the S&P 500 over most time horizons
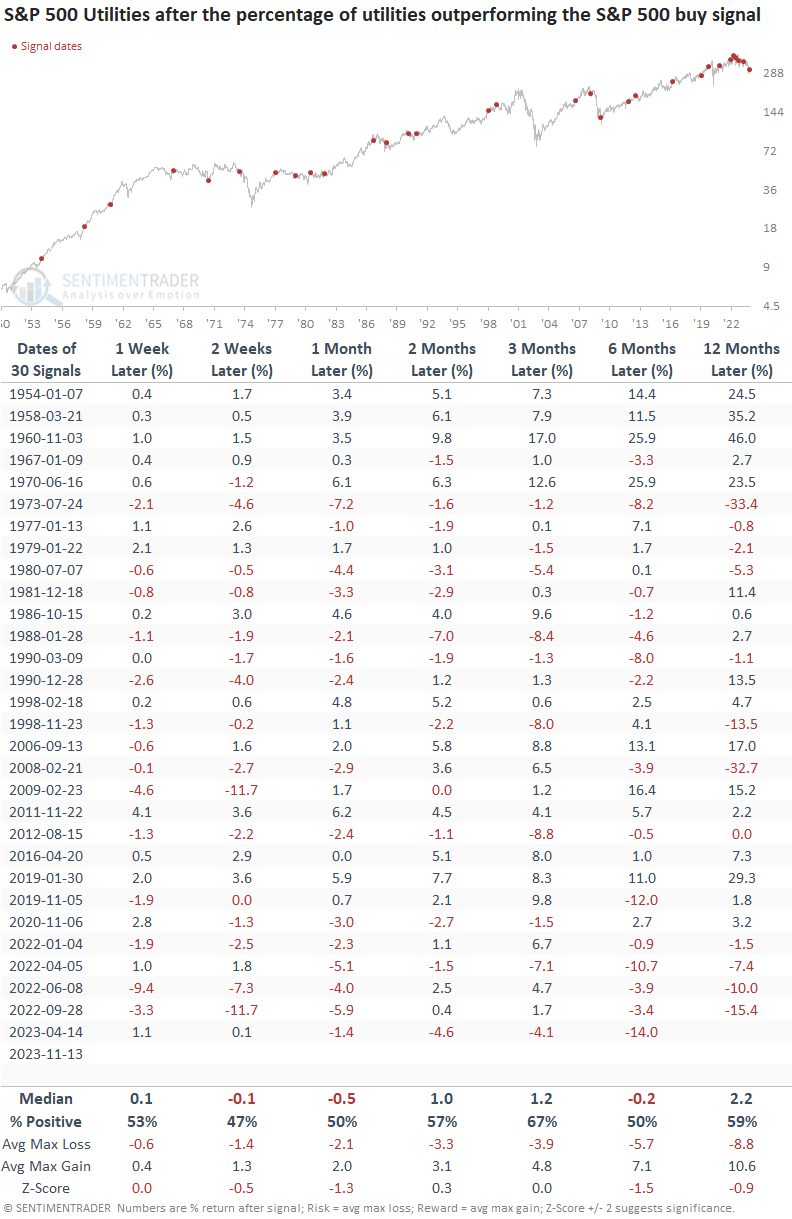
  • The S&P 500 Utility sector struggled on an absolute and relative basis across all time frames

Utility stocks as a gauge of stock market sentiment

During market upheavals, investors often turn to utilities as a go-to sector, strategically allocating their portfolios defensively to mitigate potential losses. Once market anxiety diminishes, participants shift away from the perceived safety of utilities, opting for sectors with a more aggressive stance. 

To capture this shift in investor sentiment, I calculate the difference between the percentage of Utility sector members outperforming the S&P 500 Index and the percentage of overall S&P 500 members outperforming the Index on a rolling one-month basis.

When the spread increases above 48%, indicating significant outperformance by utility stocks, and reverses below 0%, the model triggers a buy signal for the S&P 500.

Similar shifts from risk-off to risk-on preceded positive returns

Whenever the spread between Utility sector stocks outperforming the S&P 500 and all S&P 500 stocks outperforming the benchmark cycled from greater than 48% to less than 0%, the S&P 500 showed a solid tendency to rally over medium and long-term horizons.

While the concept of measuring defensive utility stocks relative to the broad market to gauge investor sentiment has a solid long-term track record, the signal did struggle in 2022 as the FOMC embarked on an aggressive tightening cycle, which is why it's always important to remember that no indicator is infallible and sometimes trading systems don't work in specific environments.

The S&P 500 Utility sector tends to struggle after relative performance trends between utilities and the S&P 500 shift in favor of the broad market, indicating an increased appetite for more offensive groups.  

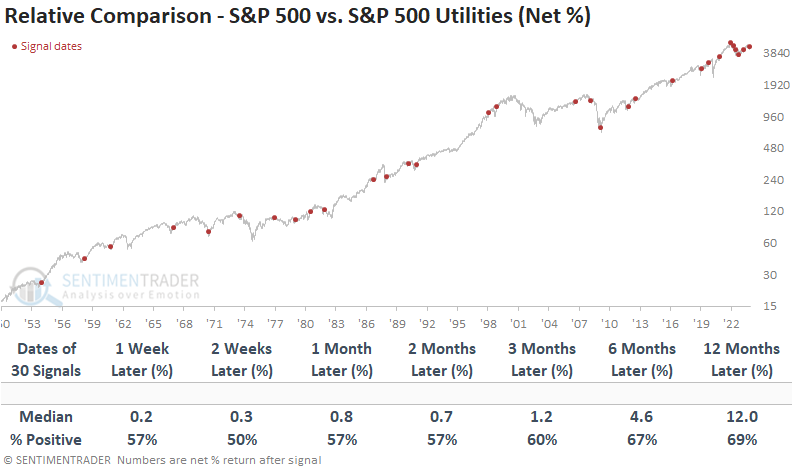
Suppose I compare the returns of the S&P 500 to those of the S&P 500 Utility sector. In that case, the outlook table shows a clear bias, suggesting an investor would be better off with an allocation to the broad market, especially over long-term horizons.

What the research tells us...

While utilities have been a massive laggard over the last year, the traditionally defensive sector caught a bid in early October as the broad market swooned to a 10% drawdown. As is typically the case in a correction, utility sector performance outpaced the S&P 500. A trading model that measures the one-month rolling return spread between utility stocks and all S&P 500 stocks increased to a historical level and subsequently collapsed, triggering a risk-on signal for the S&P 500. Similar shifts in investor sentiment produced excellent medium and long-term returns for the world's most benchmarked index. From a relative perspective, Utilities tended to underperform the S&P 500. 

PRODUCTS
SentimenTrader
Trading Tools
Indicators & Data API
‍
Strategies & Scanner
‍
Research Reports
FREE
RESOUrCES
Simple Backtest
Calculator
Simple Seasonality
Calculator
The Kelly Criterion
Calculator
Sentiment Geo Map
‍
Public Research Reports
‍
Education
Sentiment Indicators
‍
Technical Indicators
‍
Pricing
Bundle pricing
‍
FAQ
‍
Announcements
‍
COMPANY
‍
About
‍
In the News
‍
Testimonials
‍
Client Success Stories
CONTACT
‍
General Inquiries
‍
Media Inquiries
‍
Financial Professionals Inquiries
‍
© 2026 Sundial Capital Research Inc. All rights reserved.
Setsail Marketing
TermsPrivacyAffiliate Program
Risk Disclosure: The information and tools provided are for research and analytical purposes only and are not intended as investment advice. Market analysis involves uncertainty, and outcomes may differ from expectations. Users should conduct their own due diligence and consider their individual circumstances before making any financial decisions. Past performance is not necessarily indicative of future results.

Hypothetical Performance Disclosure: Hypothetical performance results have many inherent limitations, some of which are described below. No representation is being made that any account will or is likely to achieve profits or losses similar to those shown; in fact, there are frequently sharp differences between hypothetical performance results and the actual results subsequently achieved by any particular trading program. One of the limitations of hypothetical performance results is that they are generally prepared with the benefit of hindsight. In addition, hypothetical trading does not involve financial risk, and no hypothetical trading record can completely account for the impact of financial risk of actual trading. for example, the ability to withstand losses or to adhere to a particular trading program in spite of trading losses are material points which can also adversely affect actual trading results. There are numerous other factors related to the markets in general or to the implementation of any specific trading program which cannot be fully accounted for in the preparation of hypothetical performance results and all which can adversely affect trading results.

Testimonial Disclosure: Testimonials appearing on this website may not be representative of other clients or customers and is not a guarantee of future performance or success.