
Utilities see rare momentum thrust as insiders hesitate

Key points:
- Rosy projections have caused investors to rush into utility stocks, pushing them well above long-term trends
- Staid sectors like utilities have a long track record of reacting poorly to periods of high positive momentum
- Forward returns after moves like this are consistently poor as insiders hold off on buying and retail rushes in
A big boost for a staid sector
When it comes to broad thematic market moves, we usually see first-movers bid up the prices of the most obvious candidates first, then sell to trend-followers and shift their buying focus to second-order beneficiaries.
That's what we've seen in recent weeks with the AI theme. Big funds bought the first-order stocks like Nvidia, then sold into a retail mania and have since focused on the companies that need to power that theme, utilities. Some stocks, like Vistra, Constellation Energy, and NRG Energy, have rocketed since Microsoft announced a power agreement to restart Three Mile Island.
These moves helped push the popular XLU fund to 20% above its 200-day moving average. Such a massive move above trend is nearing unprecedented territory for a staid widows-and-orphans fund like this.
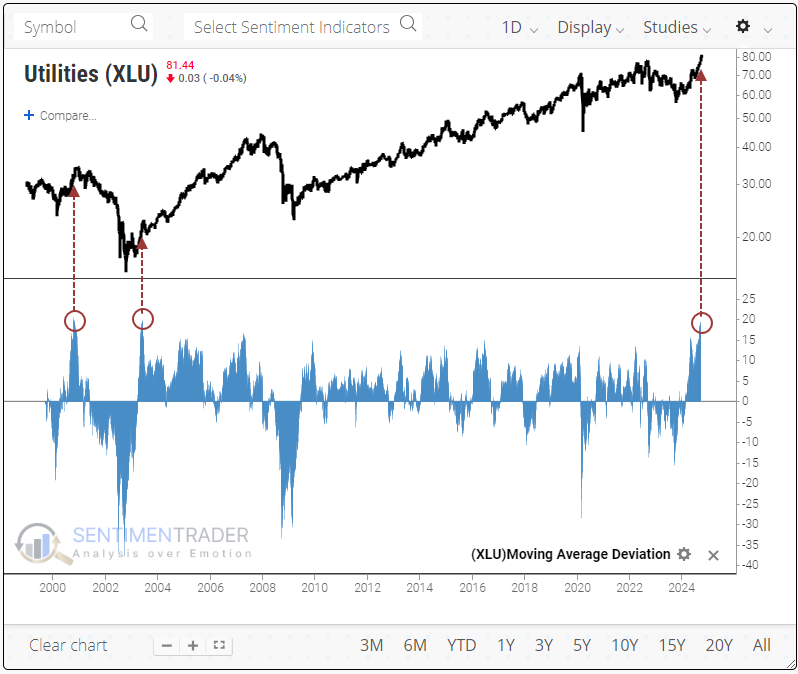
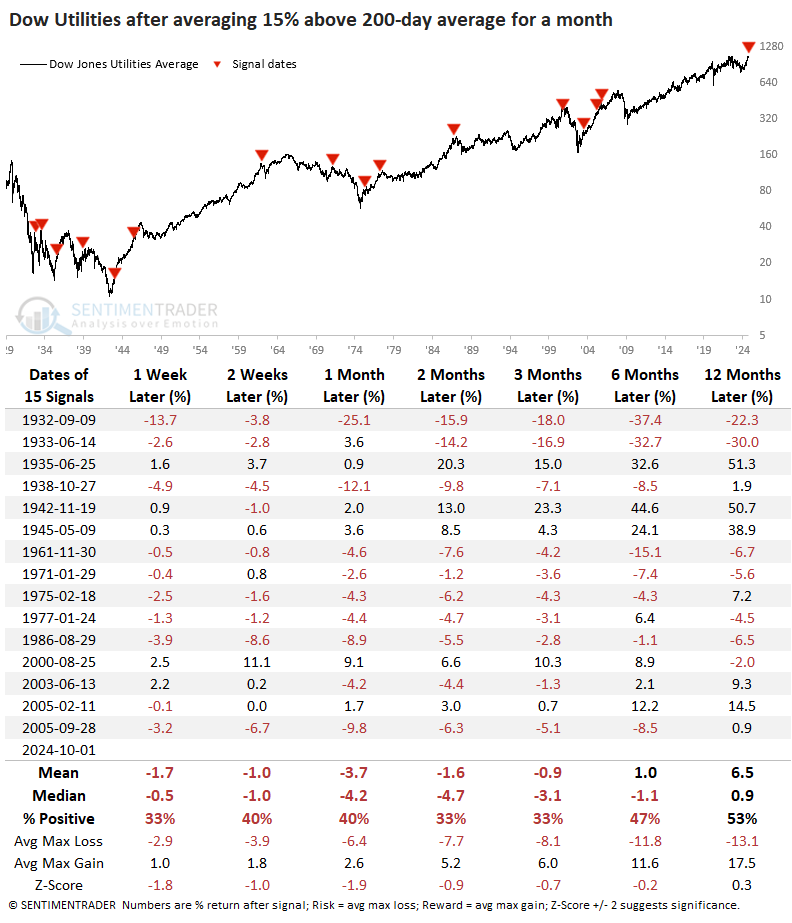
We can read much into a few precedents, so the table below looks at every time the Dow Jones Utilities Index jumped more than 15% above its 200-day average. It had been nearly 20 years since that index witnessed such a move, and as we've discussed many times before, this sector has had a heck of a time holding bursts of positive momentum.
Over the next 2-3 months, utilities showed a strong tendency to reverse part of the momentum, with poor returns and unappetizing risk relative to reward for late buyers. There were a few exceptions, most notably before 1950. The only instance since then, when utilities held and built on gains over a longer time frame, was early in 2005.
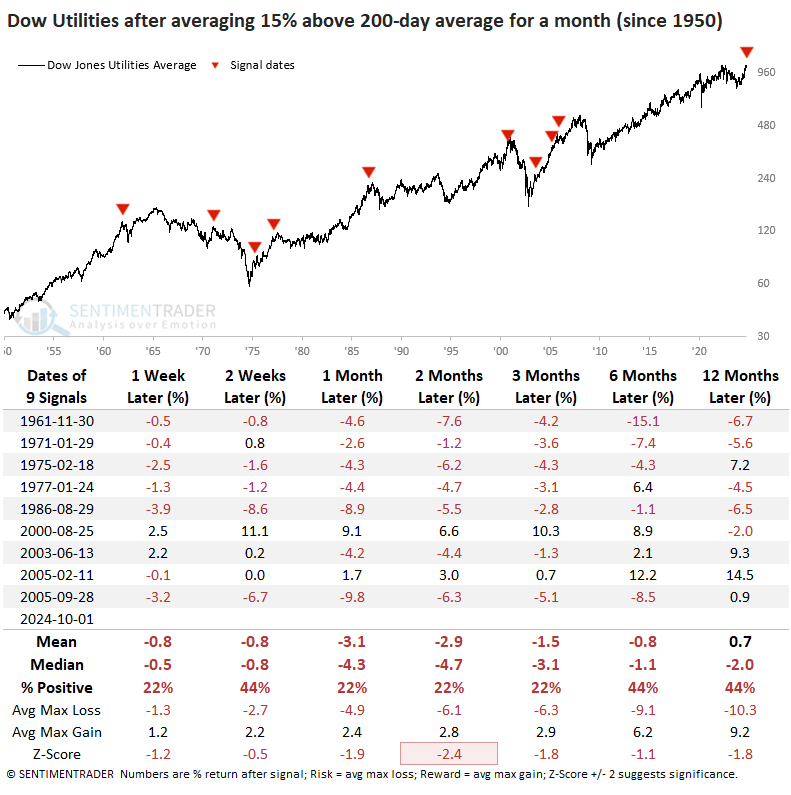
The poor average returns and risk/reward ratio become more apparent if we filter the table above to include instances since 1950. The win rate drops to 22%, average returns become significantly worse, and the ratio of average gains to losses becomes even more stark.
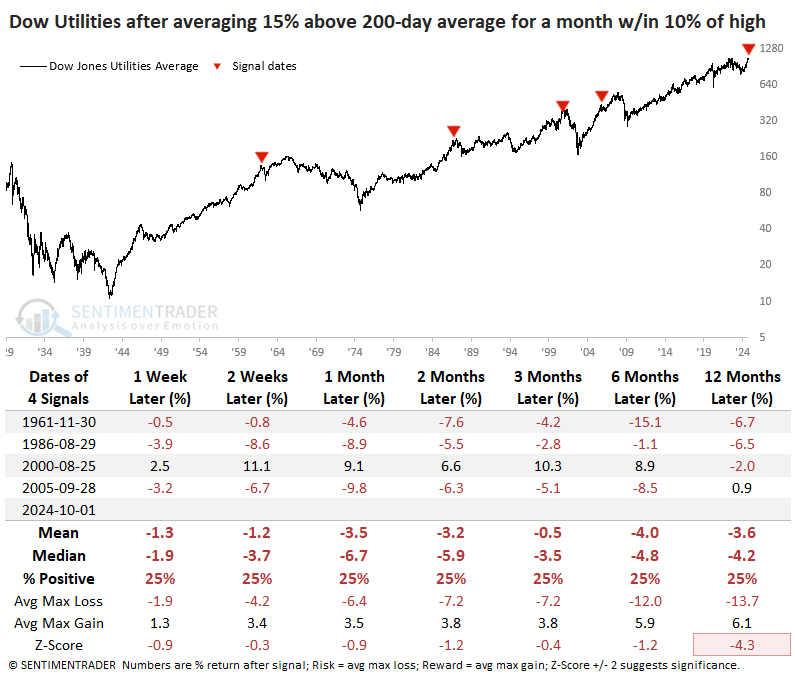
If we alternatively filter for times when utilities were not emerging from a correction and were within at least 10% of a record high, we can see that each instance was a poor time to invest in the sector. The index gained double-digits over the next few months in 2000 as the internet bubble popped, but that also evaporated.
Internal cracks as smart money hesitates
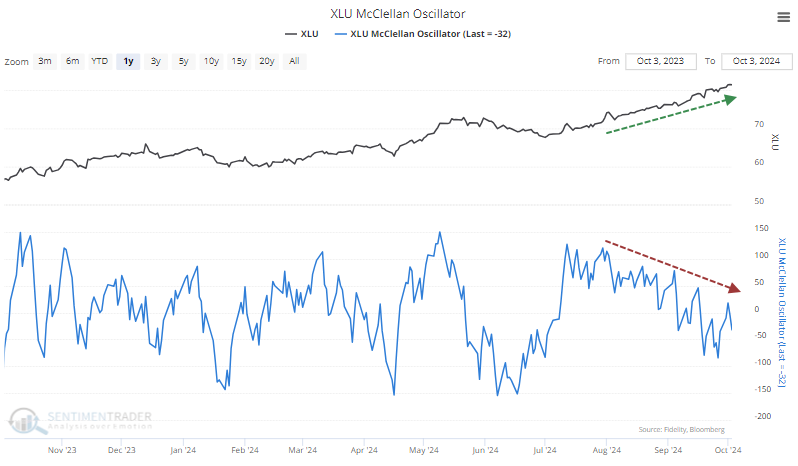
As XLU has ground higher in recent months, the internal strength of gains has slipped. The McClellan Oscillator has diverged since August and has mostly held below the zero line for the past few weeks.
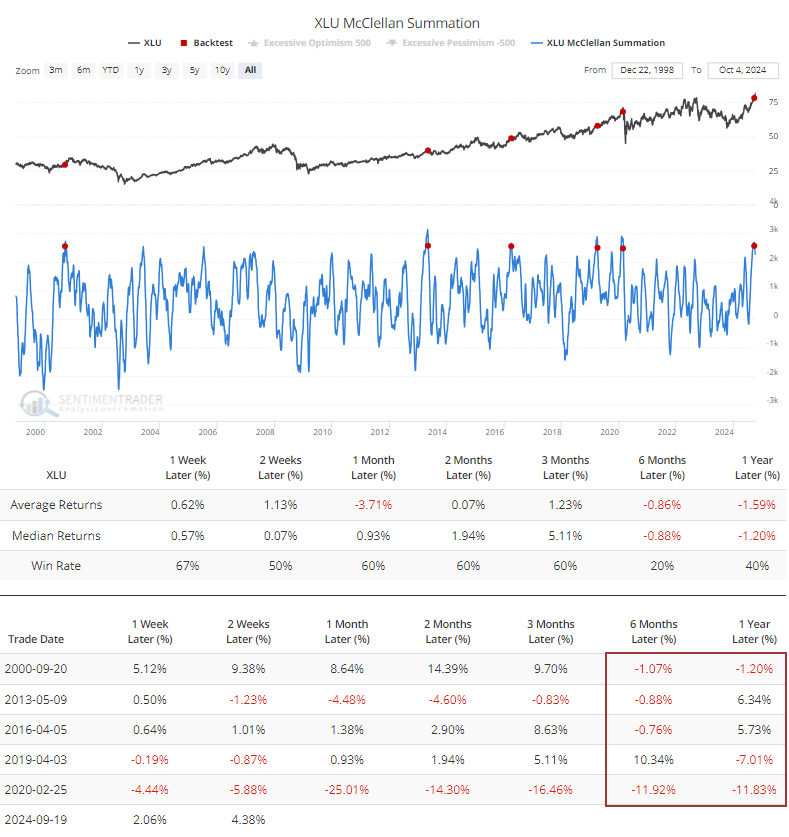
That activity has caused the longer-term Summation Index to curl and form a peak. The other times it behaved like this, the fund showed poor returns over the next 6-12 months.
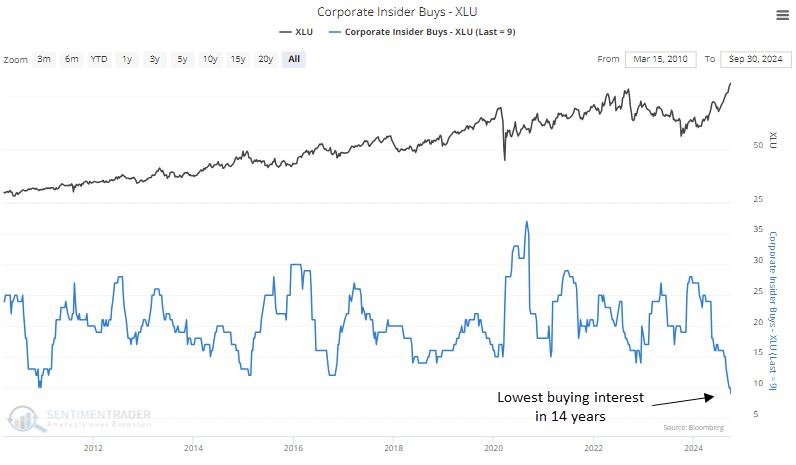
During this time, insiders have been on a buying strike. The rolling six-month sum of share purchases among corporate insiders has plunged, showing the lowest buying interest in 14 years.
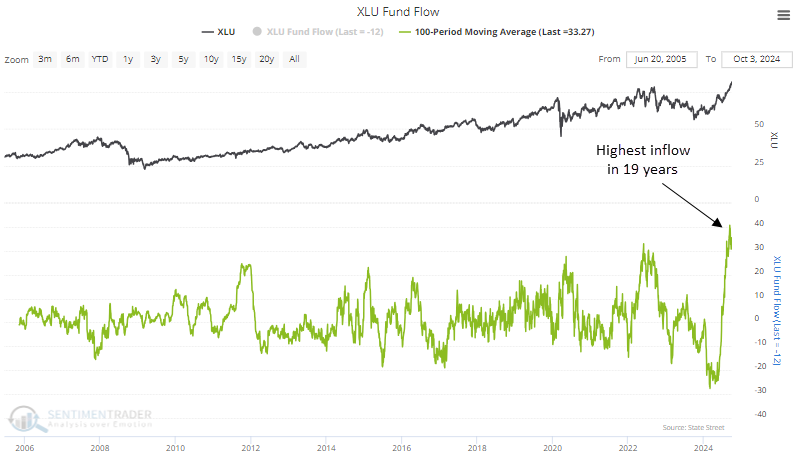
At the same time that insiders were pulling back on their purchases, the (mostly) retail traders in the XLU fund were piling in. The 100-day average fund flow into XLU has surged to the highest level in its history.
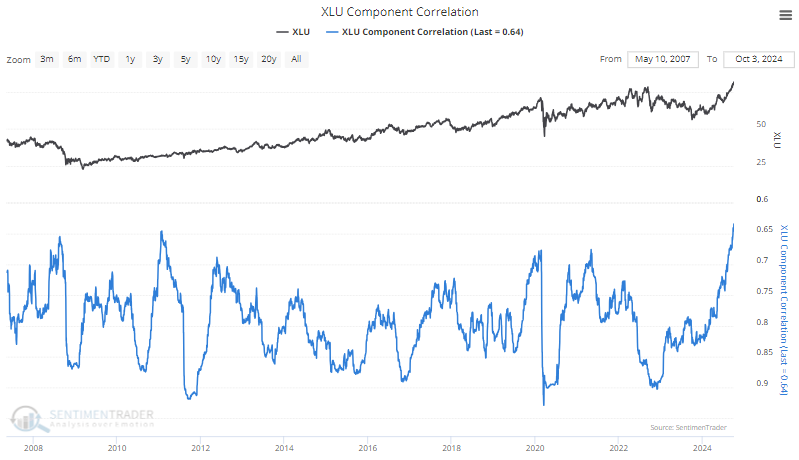
When investors panic, they sell almost all stocks in a sector or index simultaneously, regardless of merit; correlations among stocks rise toward 1.
When they become comfortable, they trade stocks on their individual merits. That's what we're seeing now in utilities. Correlation among those stocks has cratered to the lowest in at least 15 years, a stark change from 2022-23, when correlations were significantly higher. The scale on the chart below is inverted to more clearly show the relationship between price action and correlations.
What the research tells us...
The fundamental case for utilities becomes harder as interest rates rise, so it will be interesting to see how investors treat the sector as 10-year yields climb back above a round number. So far, they've been willing to forgive any challenges as they become enamored with a new narrative, but that usually only lasts so long before they require some hard numbers.
Not all indicators related to utilities are in alignment - most breadth metrics do not show any kind of negative divergence, and that's definitely a point in bulls' favor. The biggest stumbling block for bulls - and this has been the case for 70 years - is that staid sectors like utilities tend to react terribly to periods of high positive momentum. Finding new investors willing to buy into rapidly increasing expectations in a sector mostly known for dividends isn't easy. That's why the new narrative about AI is so important for the group, and any crack in that story should cause a rapid recalculation of forward returns.