
Utilities offer an alternative for income oriented investors

Key points
- Several indicators have flashed favorable signals for the utility sector in recent months
- This confluence of indicators creates a favorable "weight of the evidence" environment for utilities
- Utilities are usually not a leader in a bullish environment but still offer a solid opportunity for income-oriented investors and those seeking lower volatility
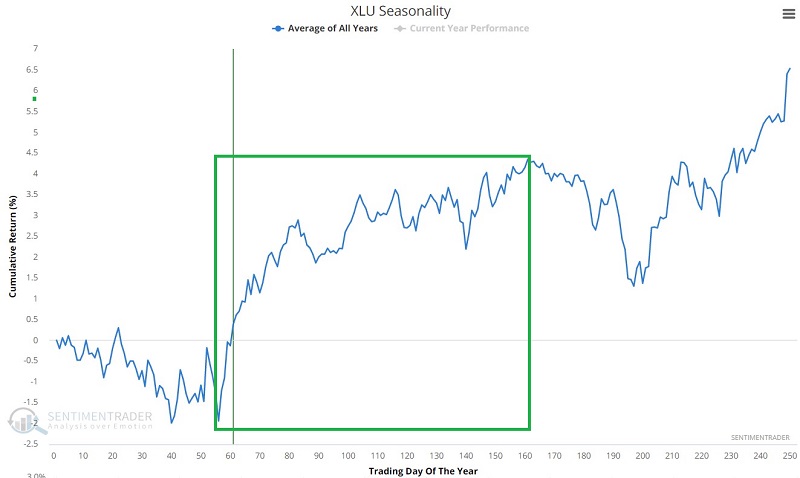
Utilities tend toward strength during the middle of the year
The chart below displays the annual seasonal trend for utilities and highlights the period from Trading Day of Year #56 through TDY #161. For 2023, this period extends from 2023-03-23 through 2023-08-24.
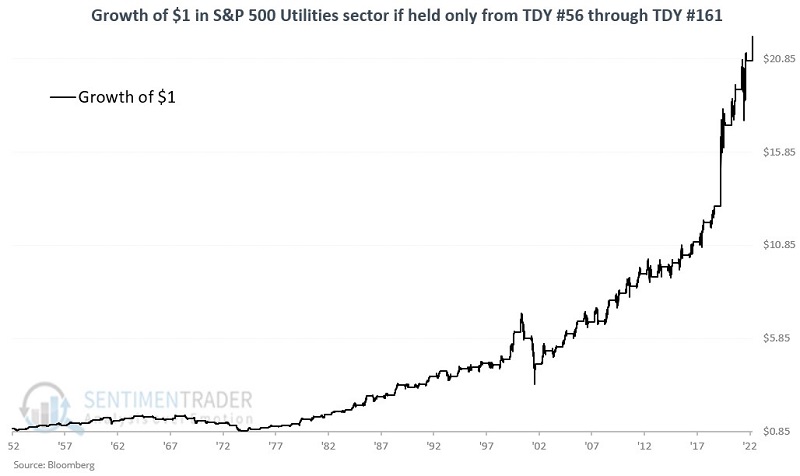
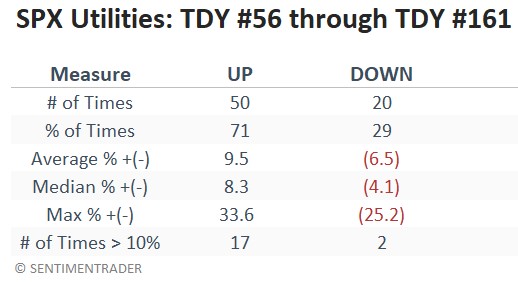
The chart and table below display performance for the S&P 500 Utilities Sector index if held only during this period every year since 1953. The results through 1974 were decidedly mixed. Since then, this period has shown a gain in 40 of the past 47 years.
Seasonality is only one potential positive for utilities. Various other indicators have flashed positive in the past nine months as the sector (like many sectors) thrashed around, trying to establish a bottom.
An oversold breadth reading from XLU % RSI14 < 30 indicator
The chart and table below display all days when the percentage of stocks that comprise the Utilities Select Sector SPDR Fund ETF (ticker XLU) portfolio showed a 14-day RSI below 30%. This signals a deeply oversold condition.
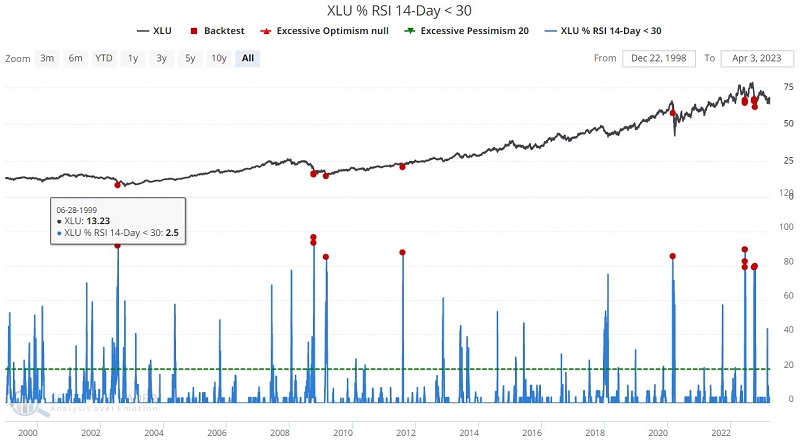
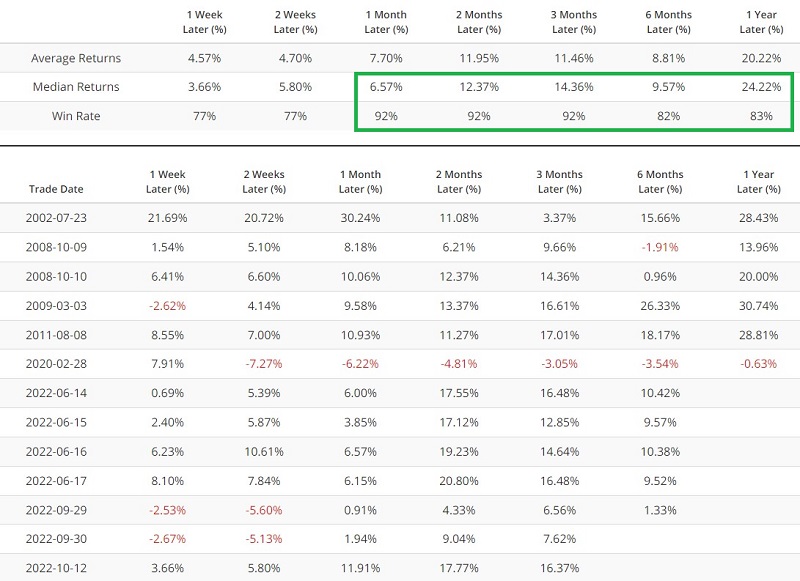
Note that some of the days highlighted occurred in June, September, and October of 2022 as utilities thrashed around, attempting to form a bottom. The most recent bounce in XLU has all of these signals slightly in the green for now. The table above shows that returns often extend between 6 and 12 months after a signal.
A deeply oversold reading from the XLU 12-week Low % indicator
This indicator shows the percentage of stocks in XLU currently trading at a 12-week low. The chart and table below display all days when the percentage of stocks that comprise XLU showed a 12-week Low % above 89%. This signals a deeply oversold condition.
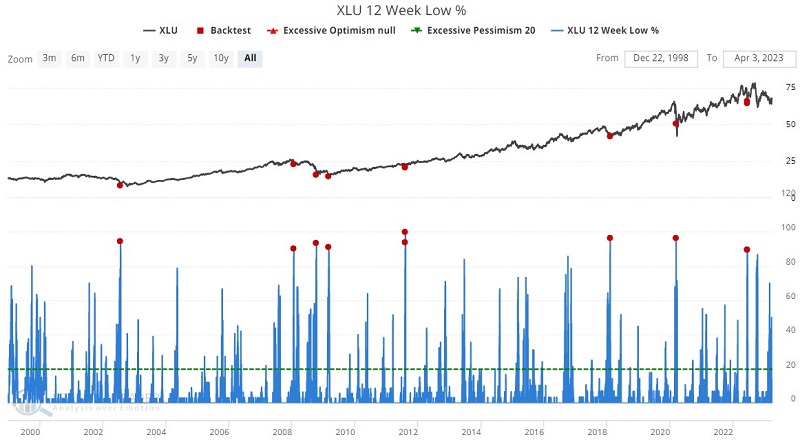
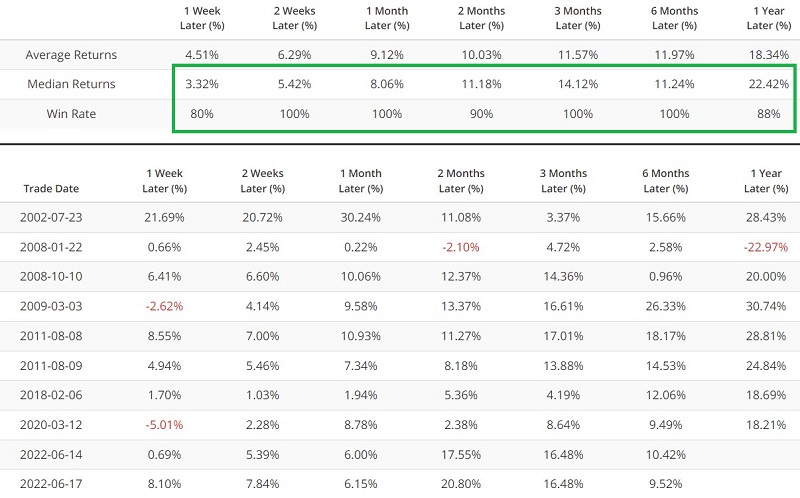
While the most recent signals (from June of 2022) might seem outdated, the fact is that historically these signals have typically remained bullish for up to twelve months (with 2008 as an obvious exception). For now, this indicator remains on the favorable side of the ledger.
A cluster of high readings from the XLU Component Correlation indicator
This indicator shows the correlation among component stocks of ticker XLU. During times of panic, investors tend to buy or sell "everything" together, no matter their individual merits, so correlation rises. The higher it goes, the more we see groupthink, which tends to happen at times of extreme pessimism and is thus usually a positive for stocks going forward.
The chart and table below display all days when the component correlation for XLU is above 0.85.
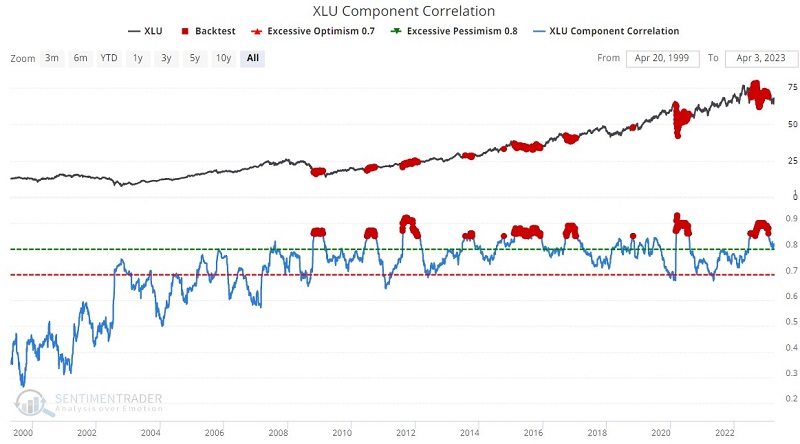
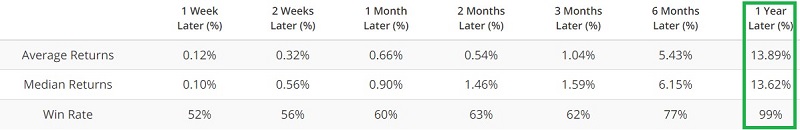
These signals tend to occur in clusters, and the first red dot in a cluster is often early. The most recent cluster started in July 2022 and ran into January 2023. Historically, 12-month returns have experienced a 99% Win Rate.
Utilities as a bond proxy can be affected by extreme Bond Risk Levels
For some income investors, holding utilities is sometimes used as a proxy for holding bonds, as utility and bond performance are tied to changes in interest rates. The chart and table below display XLU performance following all days when the 20-day moving average of our Bond Risk Levels indicator crossed above 2.
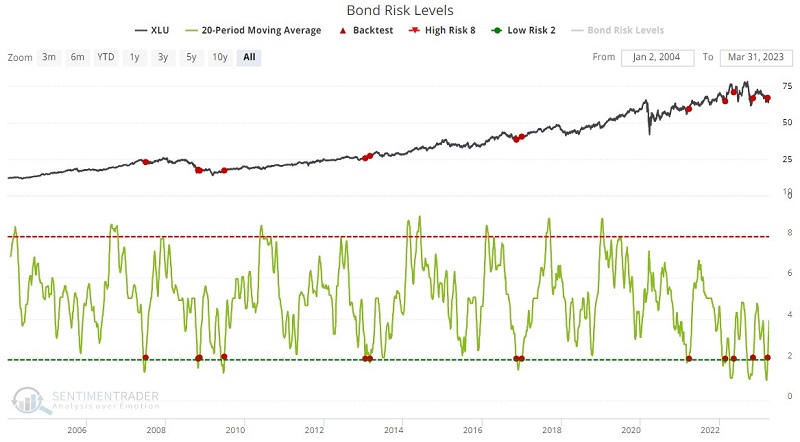
Note the cluster of signals in 2022 as XLU attempted to form a meaningful bottom. The most recent signal occurred on 2023-03-07.
A bearish sentiment extreme in 10-Year Treasury Note Optix
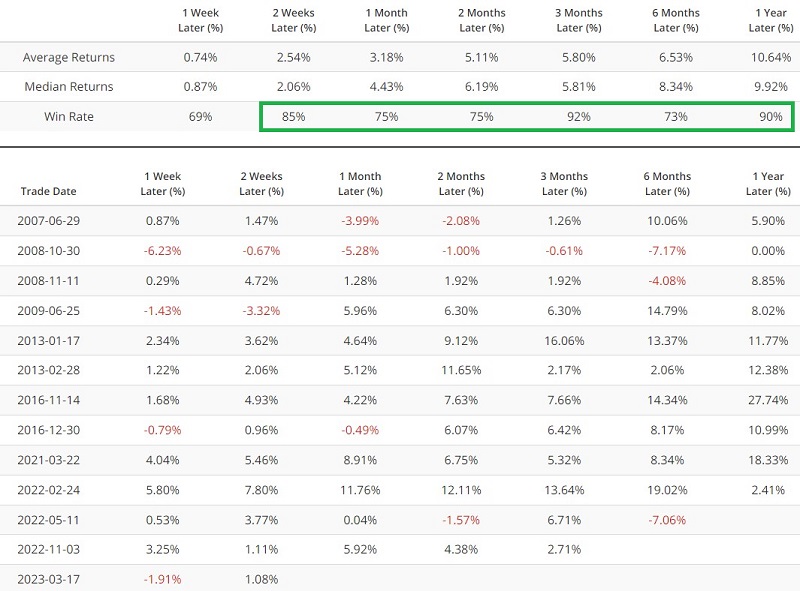
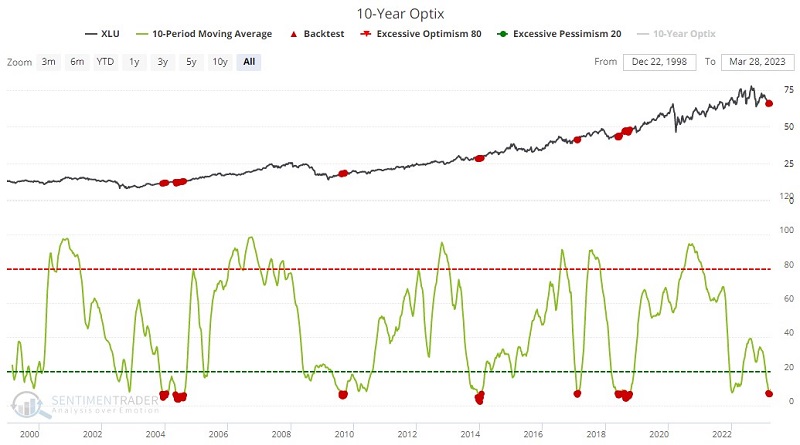
Let's consider another bond-based indicator applied to the utility sector. The chart and table below display XLU performance following all days when the 10-week moving average of our 10-Year Treasury Note Optix is below 7.5. This signal indicates an extreme degree of bearish sentiment regarding interest rate-related instruments.
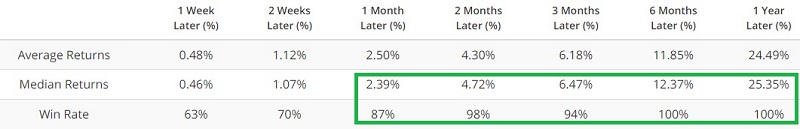
The most recent signals occurred on 3/7, 3/14, and 3/21. Note the very high Win Rates for 1-month to 1-year periods and the surprisingly high Median Return for one year.
What the research tells us…
Individually, each of the indicators detailed above may or may not pan out now as they have in the past. Taken together, though, they create a compelling "weight of the evidence" outlook for the utility sector. That said, if the stock market experiences a bullish run in the months ahead, the likelihood is excellent that other sectors may outperform utilities. Hence, this opportunity may best suit investors seeking income and lower volatility.