
Utilities are on a historic momentum streak

Key points:
- Utility stocks have been on a historic run of momentum
- Internal strength is broad, with many stocks hitting new highs under overbought conditions
- The utility sector has usually had a tough time holding buyers' interest after long positive runs
An unlikely momentum monster
One of the hottest sectors in recent weeks is usually among the most boring. It probably won't last.
We've noted many times over the years that utilities, unique among sectors, don't often react well to positive momentum. They are a highly defensive group of stocks, and the momentum factor is not usually effective over any time frame.
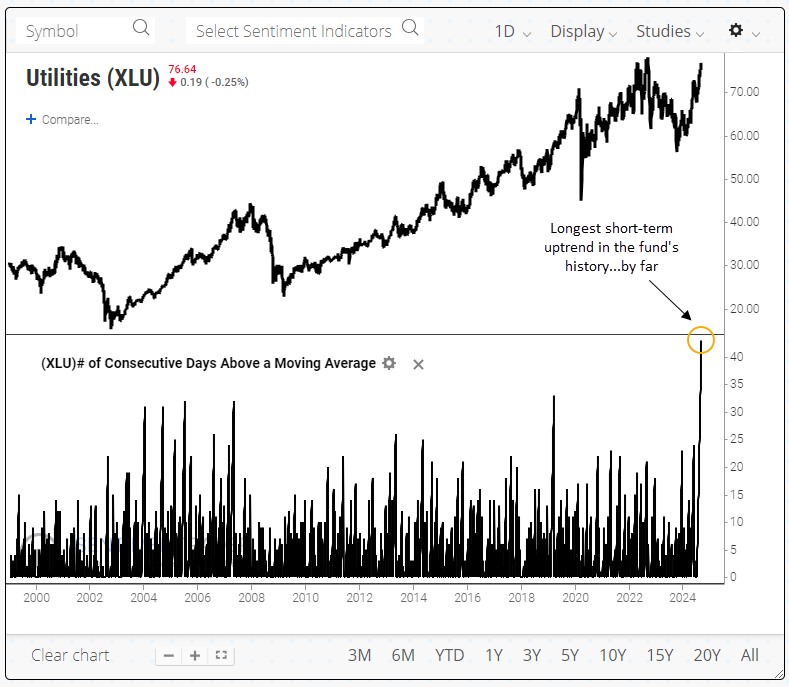
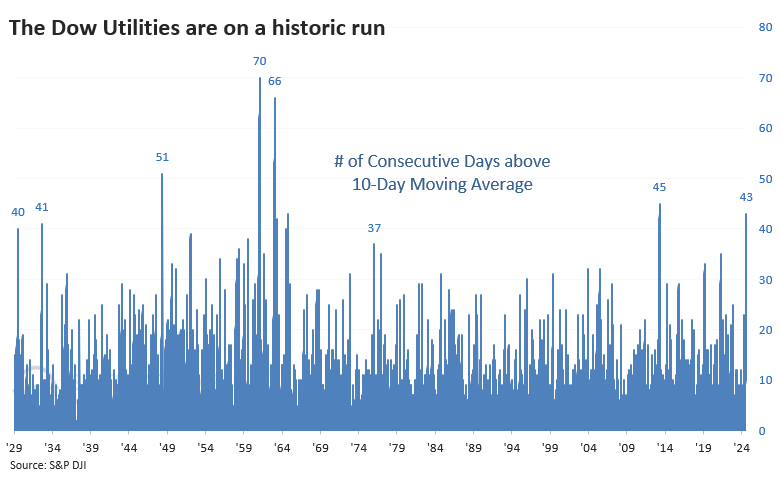
The group is at another one of those points. The XLU fund is amid a historic run, having not closed below its 10-day moving average for a remarkable 43 trading days, more than two months.
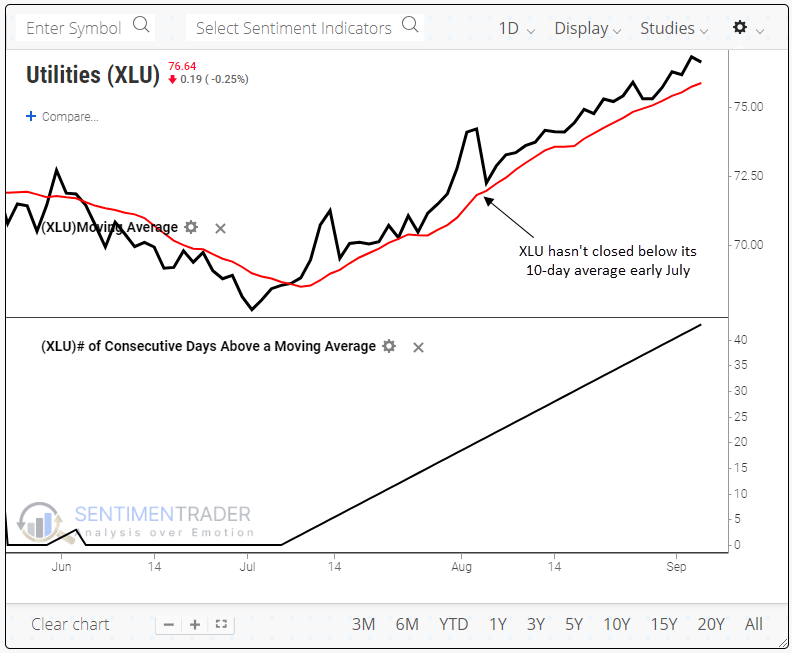
This streak exceeds any other streak since the fund's inception by far.
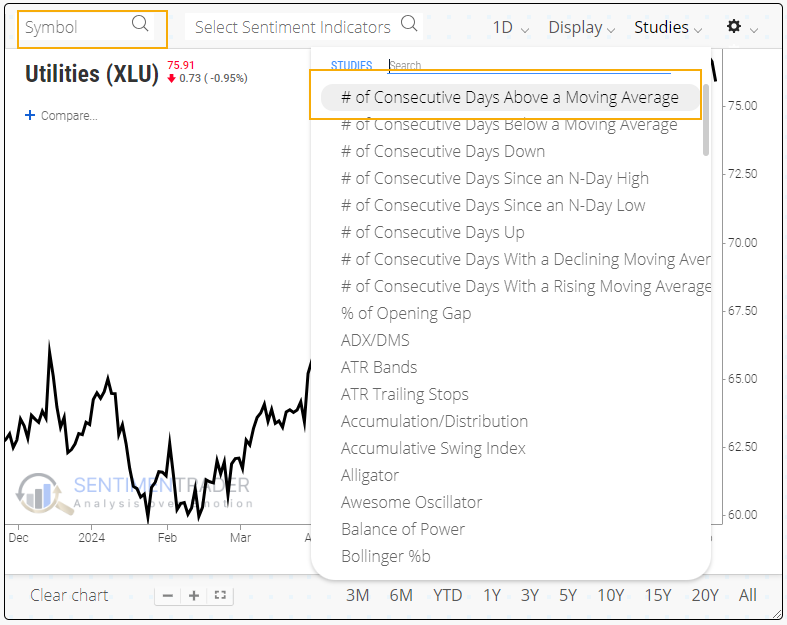
To recreate this study and backtest it, enter XLU in the symbol field, then click the Studies drop-down menu and select "# of Consecutive Days Above a Moving Average."
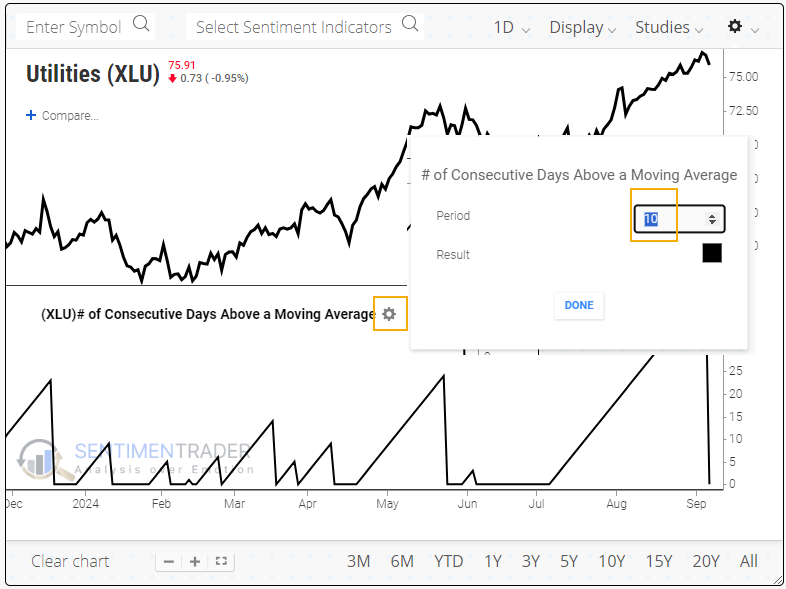
When the study loads on the chart, click the gear icon, change the Period input box to "10," and click DONE.
If we use the Dow Jones Utilities Average to go back as far as we can, we see that there have only been a handful of extreme streaks when the sector levitated for at least two full months above its 10-day moving average.
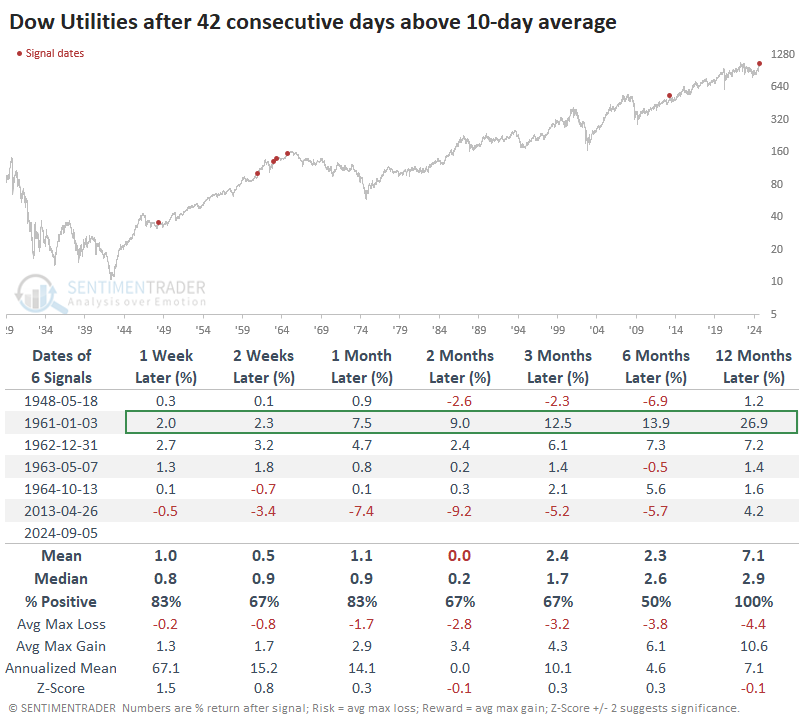
The table below shows that the other times the streak reached 42 days, utilities did okay in the months ahead, but the two-month average return was about even. Over the next year, the index showed a gain all six times, but only one was meaningful. Except for 1961, utilities struggled to show any meaningful gain (this excludes dividends).
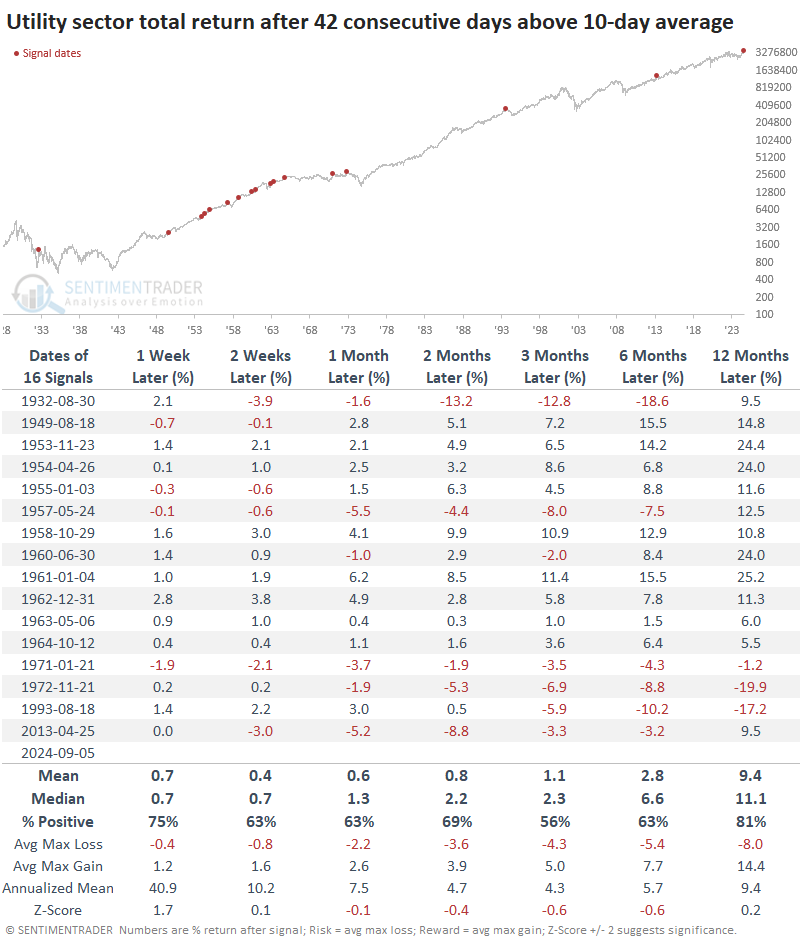
Utilities often pay a hefty dividend, so if we use a total return data series, we get a large sample size, and average returns increase. Still, over most time frames, the average return is less than any random time, and the last four signals were all substantial losers.
Most of the stocks have been surging
The indexes are not the only ones doing well; the average utility stock has also been driving higher.
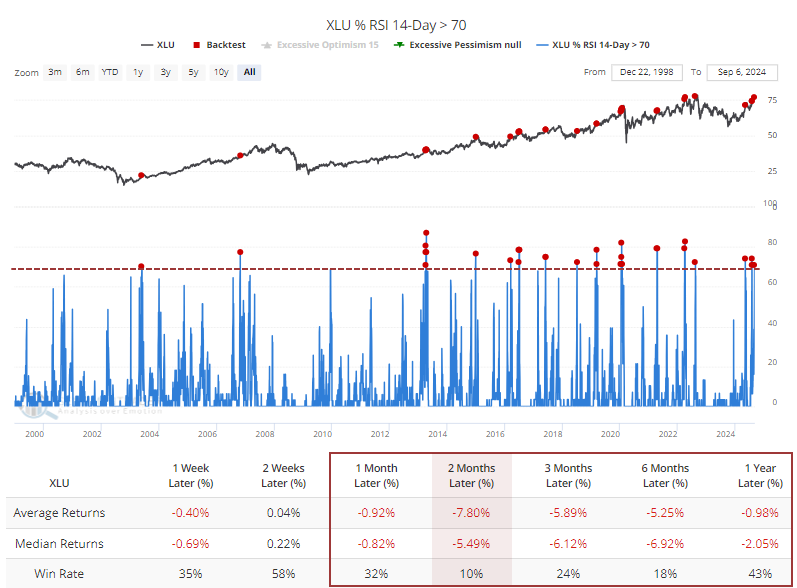
Late last week, more than 70% of stocks in the sector could be considered overbought. The Backtest Engine shows 29 days when so many utility stocks were overbought. Over the next two months, only 3 of those days sported a positive return, and all three gains were small.
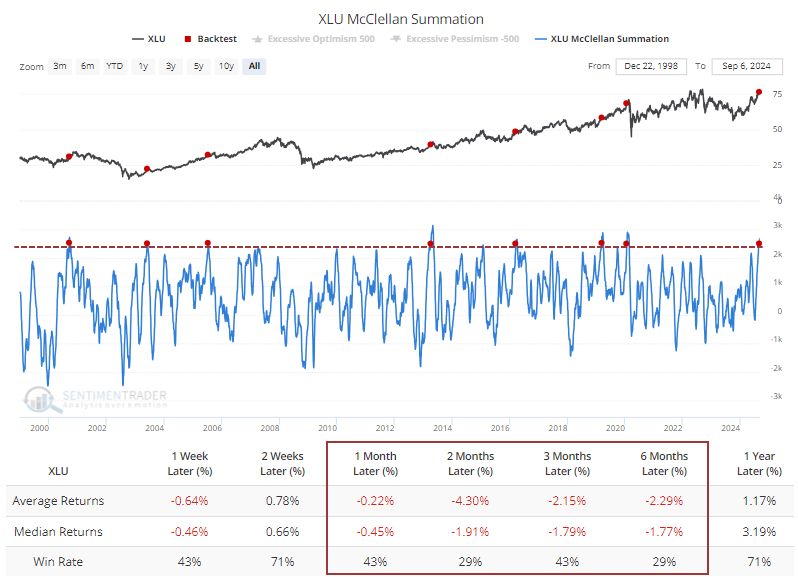
On a longer time frame, internal momentum has been persistent enough that the McClellan Summation Index for utilities has crossed +2500, an extremely high level for this sector. Again, the Backtest Engine shows poor returns going forward.
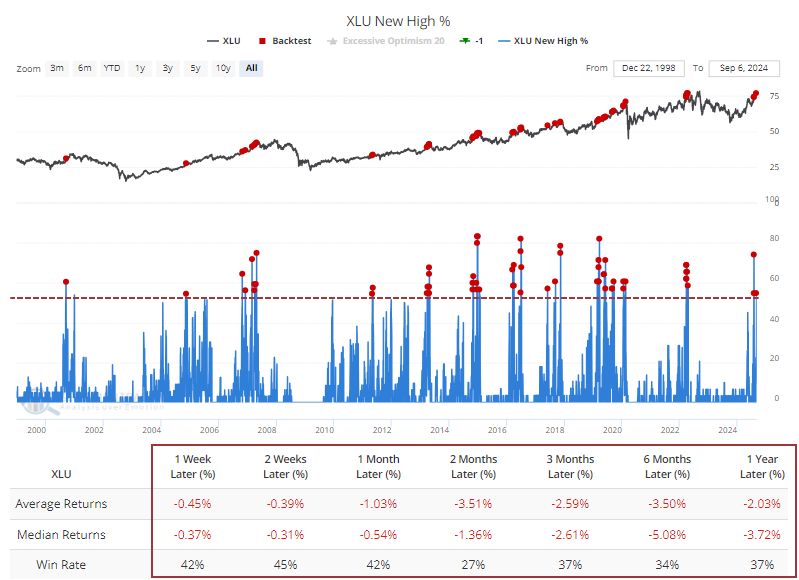
Thanks to the persistent rise, more than half of the stocks hit a 52-week high on the same day. Once again, the Backtest Engine tells us the sector hasn't consistently maintained this upside momentum over the past 25 years.
What the research tells us...
Fears of slowing growth or even - gasp! - a modest recession have caused investors to sell tech and buy defensive stocks. It hasn't taken long, and there are signs of excess already. Defensive stocks perform relatively well during slowdowns, so that's not the issue.
The issue is that chasing these stocks after they've already had a good run significantly dents forward returns. No sector better personifies the dangers of chasing upside momentum than utilities. Over the past 50 years, in particular, the sector has had a heck of a time maintaining buyers' interest after a surge.