
Using the metals and mining sector to trade bonds

Key Points
- The metals and mining sector has a solid correlation to interest rates
- This sector also has a strong correlation to inflation
- These factors make the metals and mining sector a useful contrary indicator for bonds, particularly long-term treasuries
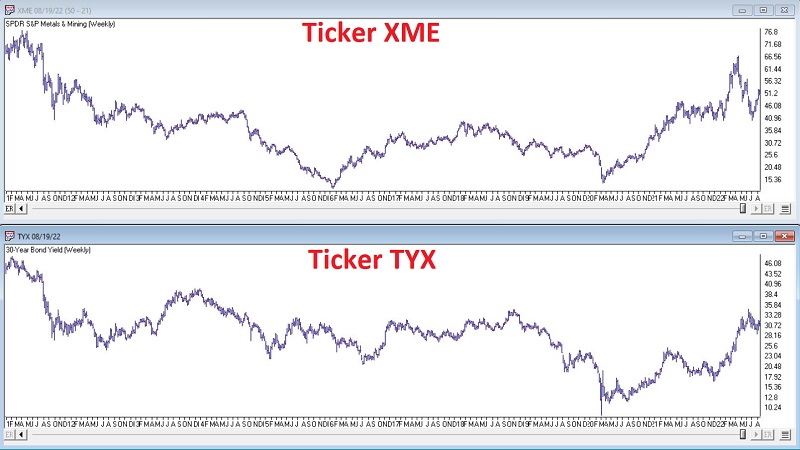
S&P 500 metals and mining sector versus interest rates
Ticker XME (SPDR S&P Metals & Mining Sector) ETF tracks the S&P 500 metals and mining sector. The chart below (courtesy of AIQ TradingExpert) displays a weekly chart of XME on the top and a weekly chart of 30-year treasury bond yields (ticker TYX). Note how closely XME and interest rate movements track one another.
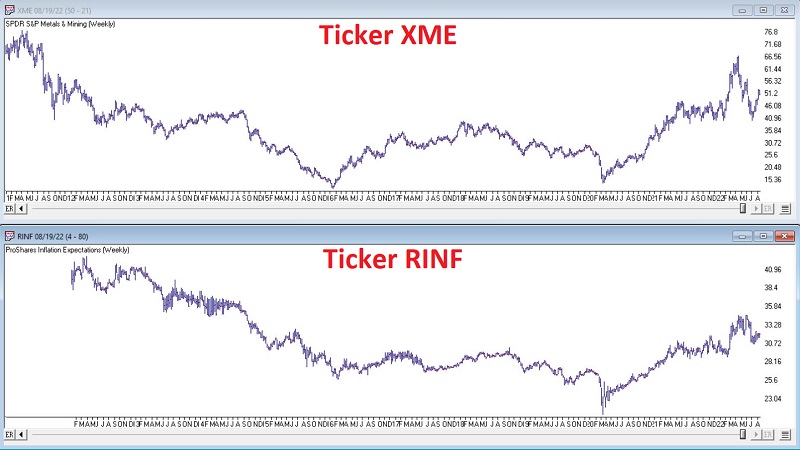
S&P 500 metals and mining sector versus inflation
We will use the ticker RINF (ProShares Inflation Expectations ETF) as a proxy for inflation. The chart below displays a weekly chart of XME on the top and a weekly chart of ticker RINF on the bottom. Note how closely XME and inflationary expectations track one another.
Using XME to trade bonds
Rising interest rates and high and/or rising inflation are the enemies of fixed-income securities such as bonds. By tracking the trend of XME, we can ostensibly identify when these factors are working for or against bond prices.
To keep it simple, the chart below displays ticker XME with 5-week (red line) and 30-week (black line) moving averages in the top clip. When the 5-week average is above the 30-week average, XME is deemed to be in an uptrend (which is harmful to bonds as it suggests higher rates and/or rising inflation). Conversely, when the 5-week average for XME is below the 30-week average, XME is deemed to be in a downtrend, which is considered positive for bonds.
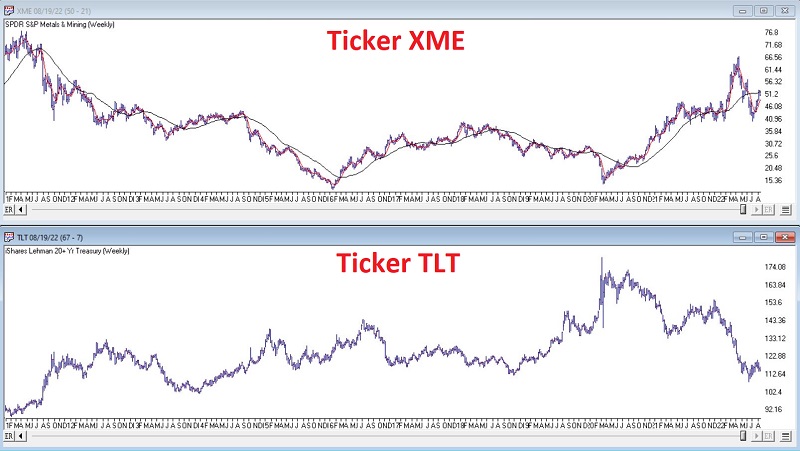
At the moment, the 5-week XME average is below the 30-week average. This bullish for bonds configuration began on 2022-06-24.
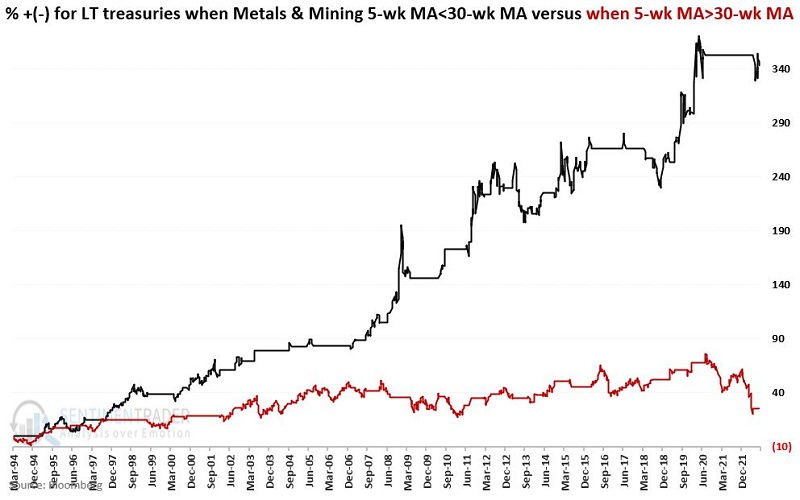
Measuring results using treasury bond total return
We will use index data for testing purposes, as these indexes have more history than the related ETFs. We will look at the 5-week and 30-week moving averages for the S&P Metals & Mining Select Industry Index (the index that XME tracks) to determine if this sector is favorable or unfavorable for bonds.
We will use the Bloomberg Barclays 20+ Treasury Index to track bond performance, which measures the total return for long-term treasuries. Our daily data starts on 1994-03-04.
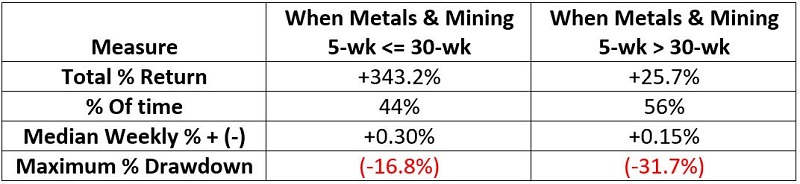
The black line in the chart below displays the cumulative % +(-) for the Treasury bond index when the 5-week average for the Metals & Mining index is below the 30-week average. The red line in the chart below displays the cumulative % +(-) for the Treasury bond index when the 5-week average for the Metals & Mining index is above the 30-week average.
The table below displays a summary of 28+ years of results.
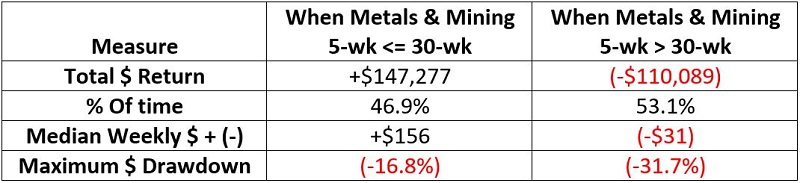
Measuring results using price return only
The results above reflect the total return, including price fluctuations plus interest. For a better idea of pure price action, let's look at results using treasury bond futures. Treasury bond futures do not pay or earn interest. They fluctuate based solely based on price action. For a full-size Chicago Board of Trade contract, a one-point movement in price equals $1,000. If the price increases one point, a trader with a long futures position gains $1,000, and a trader with a short futures position loses $1,000.
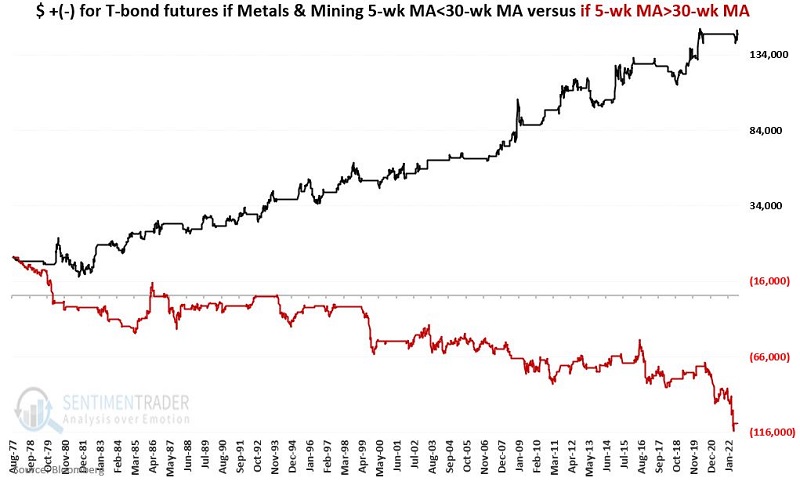
The extended history of the S&P Metals and Mining Index and CBOT treasury bond futures allows us to start this test on 1977-08-26, giving us almost 45 years of history. For this test, we will look separately at the gain or loss for t-bond futures depending on whether the 5-week moving average for the S&P Metals and Mining Index is above (red line) or below (black line) its 30-week average. The chart below displays the cumulative results since 1977.
What the research tells us…
The metals and mining sector is closely correlated to movements in interest rates and inflation, which are the two primary driving forces for treasury bonds. That makes this sector a valuable indicator for bond traders - as the results above reflect. We used the S&P Metals & Mining Index data for the tests above to generate signals. However, for practical, real-world purposes, because ticker XME tracks that index, a trader can follow the 5-week and 30-week moving averages for XME to generate signals.
Whether this 5-week/30-week method is a viable standalone strategy for trading bonds is for each trader to decide. At the very least, it might be a valuable addition to a broader bond timing method. Lastly, note that 5-weeks and 30-weeks are not optimized values but merely my go-to defaults for various strategies I follow.