
Using manufacturing data as an input for Bitcoin

Key points
- Bitcoin has a relatively short history of data
- Historical analysis of Bitcoin performance relative to any given indicator has to be taken with a grain of salt
- That said, the Purchasing Managers Index (PMI) has, to date, proven helpful - albeit far from perfect - as a trend tool for Bitcoin
The Purchasing Managers Index and Bitcoin - a simple application
What follows is NOT to be viewed as a "trading system" for Bitcoin. The signals that the method generates are NOT to be considered automatic buy and sell signals. All of this is intended as a factor to add weight - or not - to the weight of the evidence for holding a position in Bitcoin (or Bitcoin-related ETFs) at any given point in time.
The method we will examine involves the ISM PMI Manufacturing Index. Per Investing.com:
The Institute of Supply Management (ISM) Manufacturing Purchasing Managers Index (PMI) Report on Business is based on data compiled from monthly replies to questions asked of purchasing and supply executives in over 400 industrial companies. For each of the indicators measured (New Orders, Backlog of Orders, New Export Orders, Imports, Production, Supplier Deliveries, Inventories, Customers Inventories, Employment, and Prices), this report shows the percentage reporting each response, the net difference between the number of responses in the positive economic direction and the negative economic direction and the diffusion index. Responses are raw data and are never changed.
The diffusion index includes the percent of positive responses plus one-half of those responding the same (considered positive). The resulting single index number is then seasonally adjusted to allow for the effects of repetitive intra-year variations resulting primarily from normal differences in weather conditions, various institutional arrangements, and differences attributable to non-moveable holidays. The U.S. Department of Commerce supplies all seasonal adjustment factors and are subject annually to relatively minor changes when conditions warrant them.
The PMI is a composite index based on the seasonally adjusted diffusion indices for five of the indicators with varying weights: New Orders --30%, Production --25%, Employment --20%, Supplier Deliveries --15%, and Inventories -- 10%. A higher-than-expected reading should be taken as positive/bullish for the USD, while a lower-than-expected reading should be taken as negative/bearish for the USD.
Assessing the trend of PMI
PMI values are updated once a month. We will only evaluate the latest PMI reading at the end of each month, not when the newest value is reported. We have found one straightforward way to use PMI as a trend-following tool for Bitcoin:
A = The latest PMI value reported this month
B = 10-month moving average of PMI
C = A - B (calculated at the end of the month)
If C > 0, this is considered "favorable" for Bitcoin in the next month
If C < 0, this is considered "unfavorable" for Bitcoin in the next month
That's it.
Let's consider Bitcoin's performance based on these "rules." Remember that this method is NOT intended to be used as a trading system for Bitcoin. It is merely being presented as a potential input for deciding whether to be bullish or bearish about Bitcoin.
Bitcoin results when PMI is trending higher
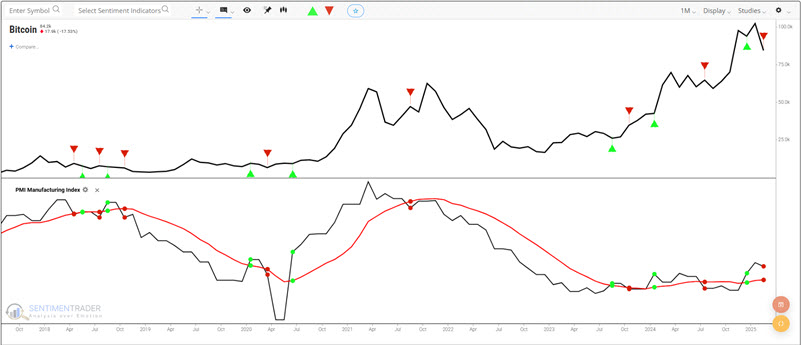
The chart below displays Bitcoin price action with the "signals" using the abovementioned method. Please note that the red "down" arrow at the far right denotes the end of the data and NOT an "unfavorable" signal (as the PMI is still above its 10-month average and thus still considered "favorable").
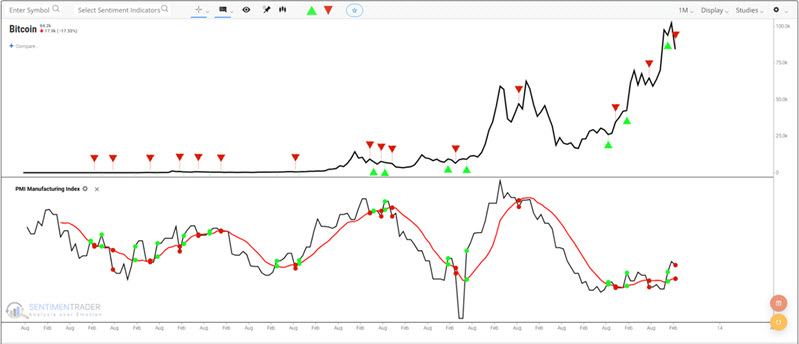
The chart below zooms in on the 2010 to 2017 period.
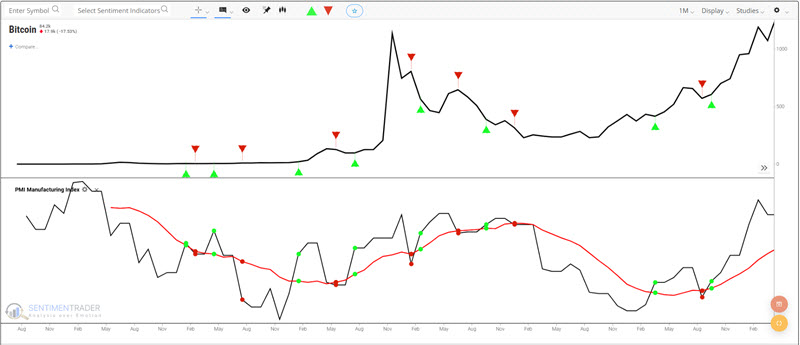
The chart below zooms in on the 2018 to present period. Please note again that the red "down" arrow at the far right denotes the end of the data and NOT a "sell" signal (as the PMI is still above its 10-month average and thus still considered "favorable").
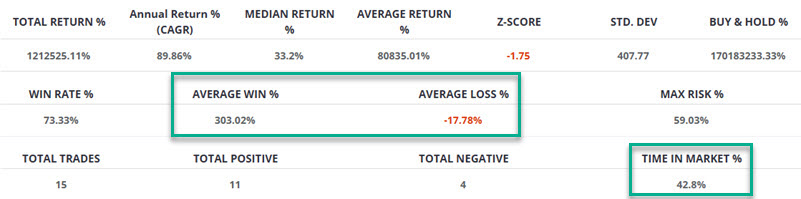
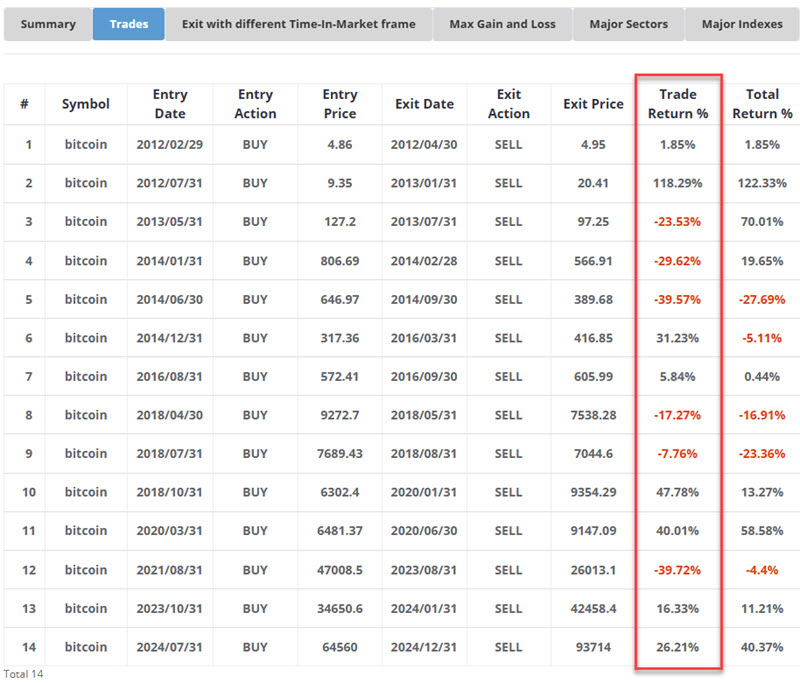
The table below displays Bitcoin's performance when PMI was above its 10-month moving average through 2024-12-31.
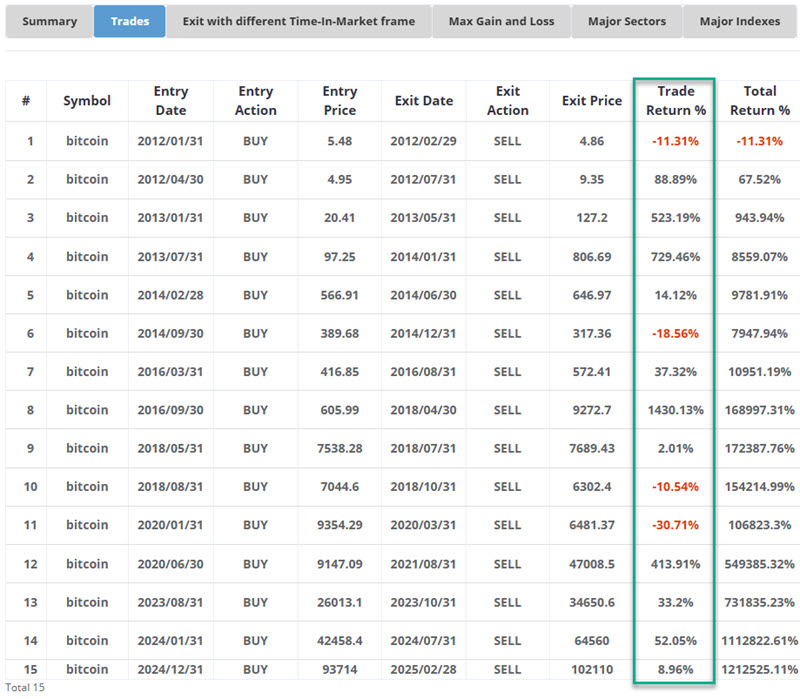
The table below summarizes Bitcoin's performance during "favorable" periods. The key things to note are a) that Bitcoin was in the market only 42.8% of the time, with an Average Win of 303% versus an Average Loss of -17.8%.
The chart below displays the hypothetical equity curve achieved by holding Bitcoin only when PMI > 10mo MA - and also reflects the inherent risk and volatility associated with holding Bitcoin even in favorable circumstances. We can note the propensity to catch significant portions of the large moves. However, we cannot ignore the significant drawdowns along the way (HINT: The large up moves are why I consider PMI as a Bitcoin input, and the drawdowns are why I don't use it as a mechanical trading system).
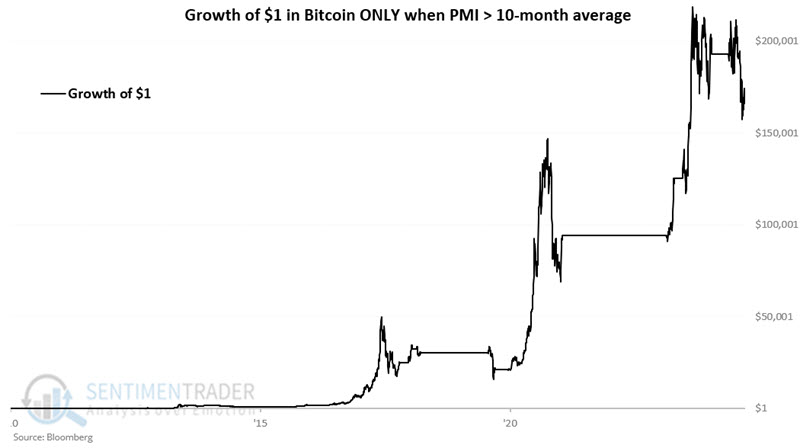
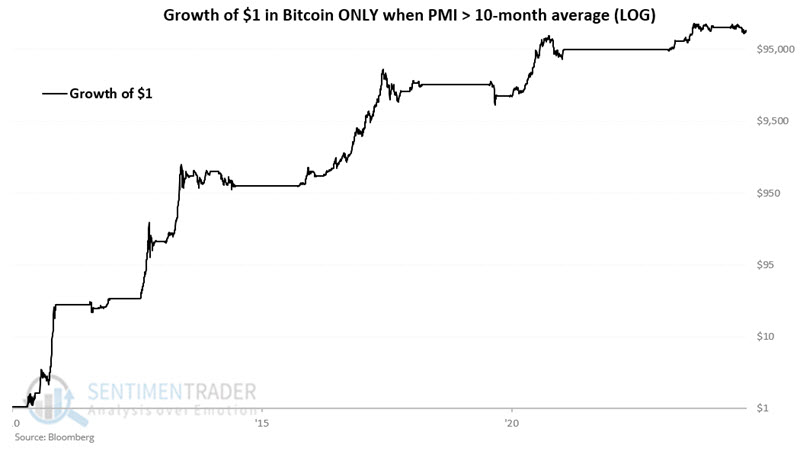
Note that since PMI turned "favorable" for Bitcoin on 2024-11-29, Bitcoin first rallied almost 10% but is now down -14% since the end of Novmber 2024. Interestingly, to put this decline in perspective, the chart below displays the same results as the chart above on a logarithmic scale. It would appear that extreme volatility and the occasional large drawdown is a way of life with Bitcoin.
To put this performance - with all of the attendant volatility and drawdowns - into full perspective, let's next assess Bitcoin's performance when PMI is below its 10-month moving average.
Bitcoin results when PMI is trending lower
Now let's look at Bitcoin performance when PMI < 10mo MA. Labeling results as "bearish" would be incorrect since there is an overall net gain. Nevertheless, it would be accurate to label results as far less favorable (and far less consistent) than performance during favorable periods.
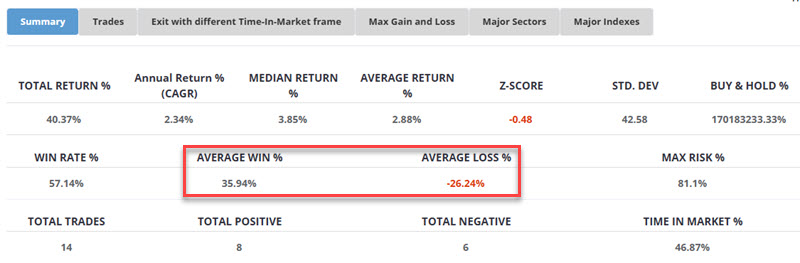
The table below displays Bitcoin's performance during unfavorable periods.
The table above displays a lot of "hit or miss." The table below summarizes Bitcoin performance during periods when PMI < 10mo MA.
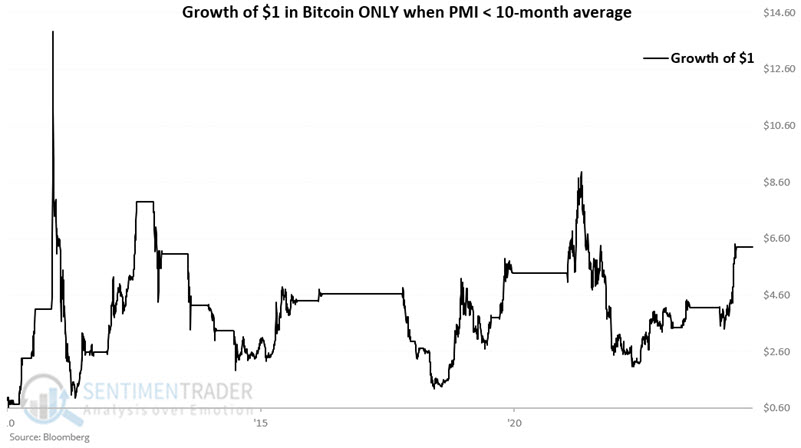
The chart below displays the hypothetical equity curve achieved by holding Bitcoin only when PMI < 10mo MA. Note the inconsistent and volatile nature of the results - particularly compared to the equity curve during favorable periods shown earlier.
The chart below displays the same results on a logarithmic basis. Note the lack of any net gains since the middle of 2011.
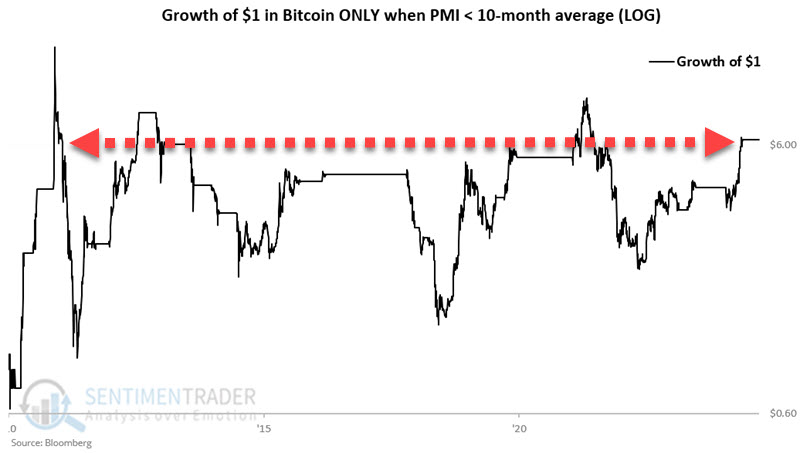
The bottom line, since July 2011, Bitcoin has gained:
- Roughly 625,700% during "favorable" periods (albeit with great volatility and some extreme drawdowns along the way)
- Roughly 0% during "unfavorable" periods
An aside on stock market performance
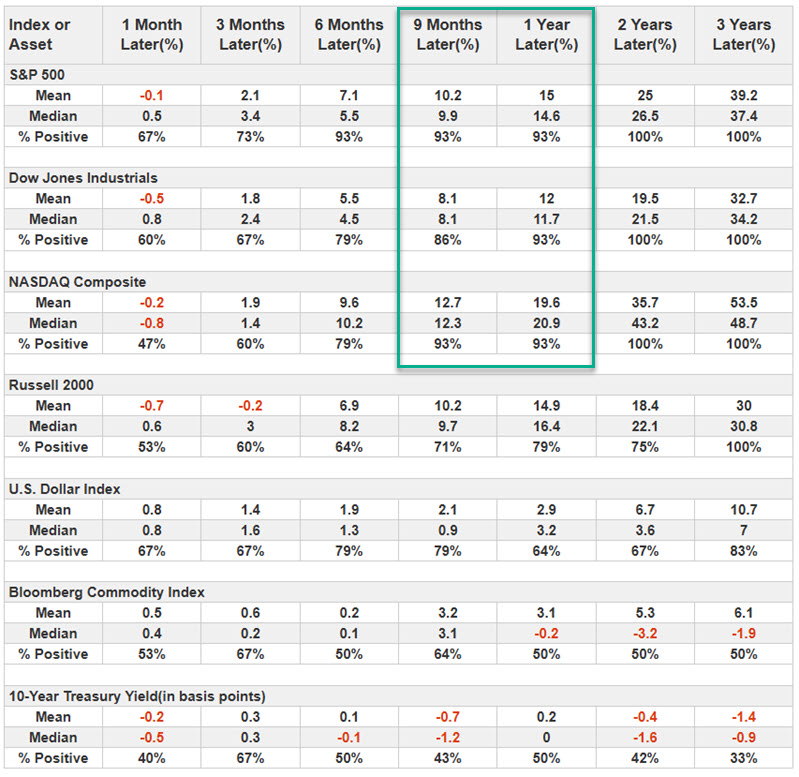
As long as we are looking at PMI, let's also look at stock market results after PMI crosses above its 10-month moving average. In the table below, note that the S&P 500, Dow Jones Industrials, and Nasdaq 100 gained 93% of the time one year after a PMI crossed above its 10-month moving average.
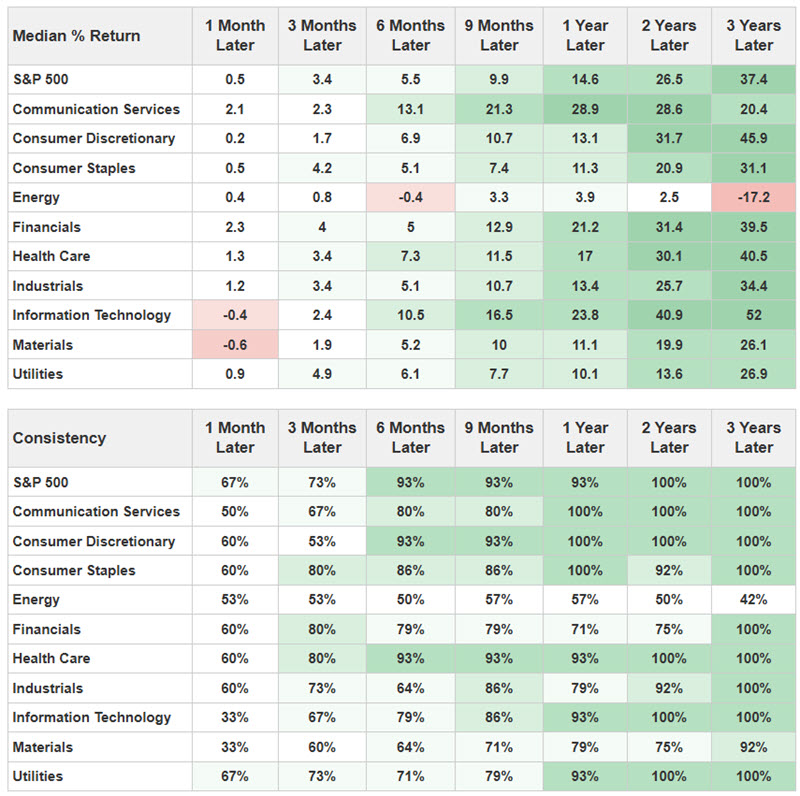
The table below shows the S&P 500 sector performance in the year following favorable PMI signals.
What the research tells us…
To attempt to use PMI as the sole input for a Bitcoin trading system would expose a trader to a great deal of volatility and downside risk and is not recommended. On the other hand, checking the status of PMI relative to its 10-month moving average before committing to Bitcoin may improve one's odds of success over time.