Using a put butterfly spread to hedge a stock portfolio (or play the short side)

A put butterfly spread can be an inexpensive way to a) hedge a stock portfolio, b) play the short side of a given market or security with limited risk (unlike selling short, which can involve unlimited risk).
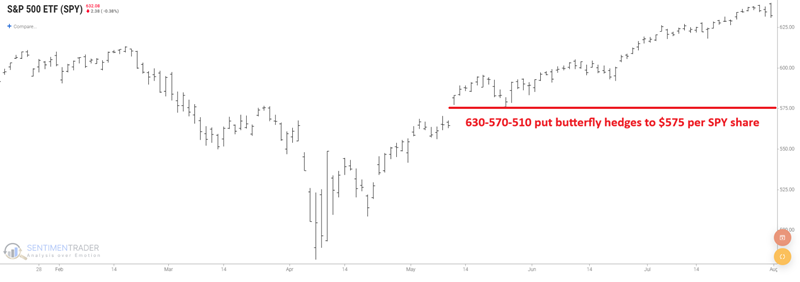
After the stock market's huge run off the April 2025 low, many investors are getting nervous about the potential for a correction. Let's consider one example of how a put butterfly spread using options on ticker SPY might help offset some risk.
The example trade below involves:
- Buying 1 SPY Oct19 630 put @ $14.20
- Selling 2 SPY Oct19 570 puts @ $4.40
- Buying 1 SPY Oct19 510 puts @ $1.69
All screenshots below are courtesy of www.Optionsanalysis.com.
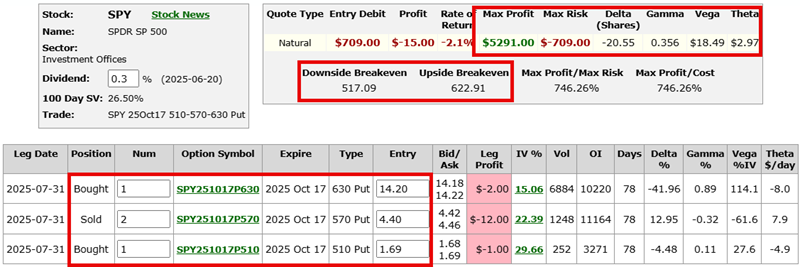
To enter a 1x2x1 spread costs $709. That is the maximum risk on this position if SPY rises or remains unchanged between now and mid-October.
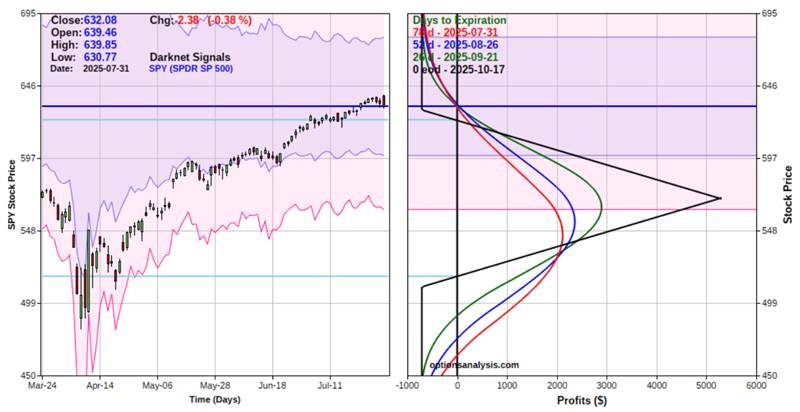
If SPY declines in price, this position will make an ever-larger profit until SPY reaches the short strike price of $570. Below that price, the risk curves for the trade "roll over." This implies that a trader holding this position will need to either take profits or adjust the trade as SPY approaches $570 a share (bottom line: This is not a "set it and forget it" type of trade).
Other details regarding option "Greeks:"
The "Delta" of -20.55 indicates that at entry, this position is roughly equivalent to selling short 20 shares of SPY
The "Gamma" of 0.356 means that this position will gain 0.356 deltas for each point SPY rises (or the delta will become even more negative for each point SPY declines in price)
The "Vega" of $18.49 implies that for each point that option implied volatility increases, this position will gain roughly $18.49 in value (NOTE: Implied volatility for stock index options tends to rise as price declines. This could add significant profit potential to this position if SPY falls)
The "Theta" of $2.97 indicates that this position will gain $2.97 in value due solely to the passage of one day (i.e., this position can benefit from time decay)
If SPY were to fall to the lower strike price of $570, this position would be expected to show a profit of between:
- $1,760 if it happened today (i.e., 78 days before option expiration - the red risk curve line on the right-hand side of the chart above)
- $2,170 if it happened on August 26th (i.e., 52 days before option expiration - the blue risk curve line)
- $2,900 if it happened on September 21st (i.e.,26 days before option expiration - the green risk curve line)
- $5,291 if it happened on October 19th (i.e., option expiration day - the black risk curve line)
This type of position can be helpful for a) a trader who wants to play the short side with limited risk, and/or b) an investor who wants to hedge an existing stock portfolio, with limited risk and without a significant dollar commitment.