Products
SentimenTrader Trading Tools
‍
Backtest Engine
My Trading Toolkit
Correlation Analysis
Seasonality
Market Prediction
Indicators & Data API
‍
Proprietary Indicators & Charts
Market Data API
Strategies & Scanner
‍
50+ Trading Strategies
Smart Stock Scanner
Smart Option Scanner
Research Reports
‍
Research Solutions
Reports Library
Free Resources
Simple Backtest Calculator
Simple Seasonality Calculator
The Kelly Criterion Calculator
Sentiment Geo Map
Public Research Reports
Education
Sentiment Indicators
Technical Indicators
Pricing
Company
About
In the News
Testimonials
Client Success Stories
Contact
Log inLoginSign up
< BACK TO ALL REPORTS

US stock indexes enter an important time of year

Jay Kaeppel
2023-03-28
The stock market appears stuck in neutral gear, and things could go either way from here. Seasonality tends to be a positive factor in the late winter to early-spring period. Will it be a factor this year? In this piece, we look at the historical record of four primary index ETFs to assess the probabilities.

Key points

  • The stock market has shown a tendency to advance during the late winter to early-spring period
  • As with any seasonal trend, there is no guarantee on a year-to-year basis
  • With sentiment presently bearish, this trend reminds us to keep an open mind regarding the potential for a surprising stock market rally 

An important time of the year

The stock market has tended to advance during the late winter to early-spring period. Specifically, we will refer to the period that extends from the closing on Trading Day of the Year (TDY) #56 through TDY #83. For 2023, this period extends from the close on 2023-03-23 through 2023-05-02. To analyze historical results, we will look at the performance of four stock index ETFs that track, respectively, the Dow Jones Industrial Average, the S&P 500 Index, the Russell 2000 Small-Cap Index, and the Nasdaq 100 Index.

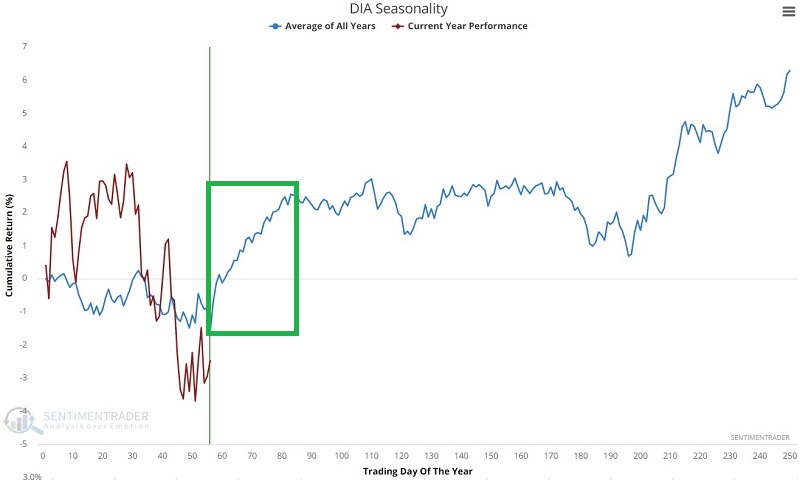
Tracking the Dow Jones Industrial Average via ticker DIA

The SPDR Dow Jones Industrial Average ETF Trust (ticker DIA) is an ETF designed to track the daily price changes for the Dow Jones Industrial Average. The chart below displays the annual seasonal trend for ticker DIA.

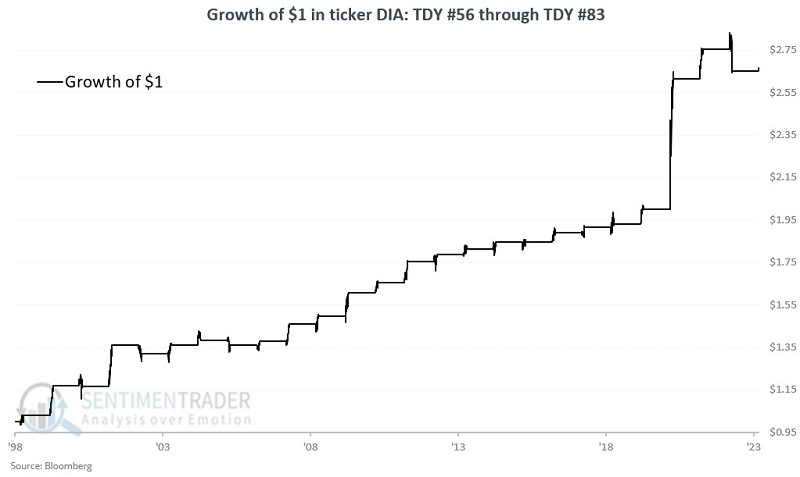
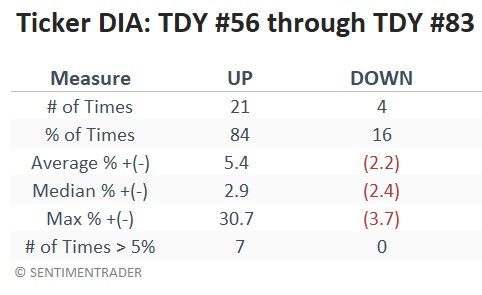
The chart and table below display the growth of $1 invested in ticker DIA only during the TDY #56 through TDY #83 period every year since 1998 and a performance summary.

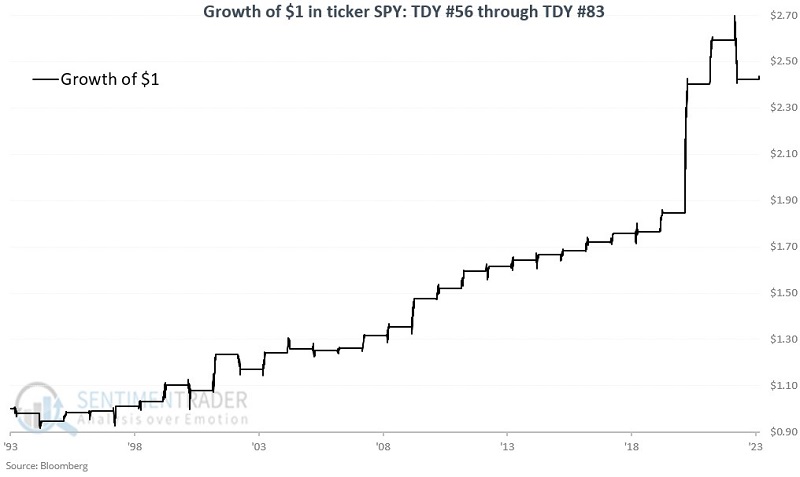
Tracking the S&P 500 Index via ticker SPY

The SPDR S&P 500 ETF Trust (ticker SPY) is an ETF designed to track the daily price changes for the S&P 500 Index. The chart below displays the annual seasonal trend for ticker SPY.

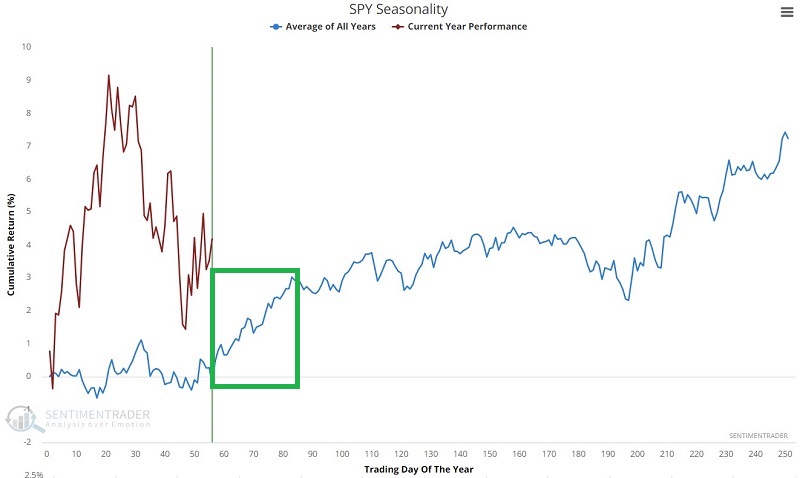
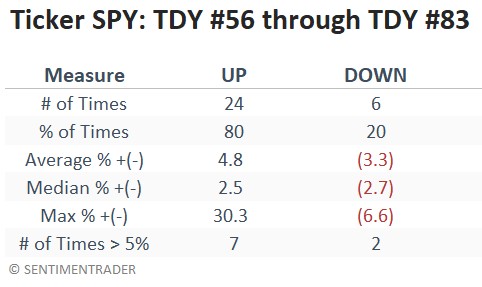
The chart and table below display the growth of $1 invested in ticker SPY only during the TDY #56 through TDY #83 period every year since 1993 and a performance summary.

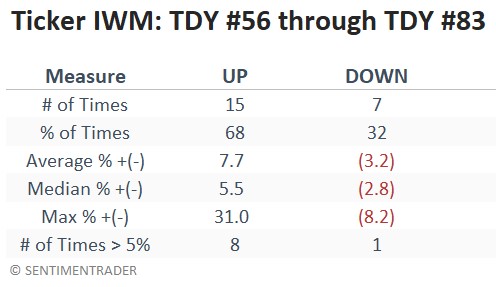
Tracking the Russell 2000 via ticker IWM

The iShares Russell 2000 ETF (ticker IWM) is designed to track the daily price changes for the Russell 2000 Index. The chart below displays the annual seasonal trend for ticker RUT.

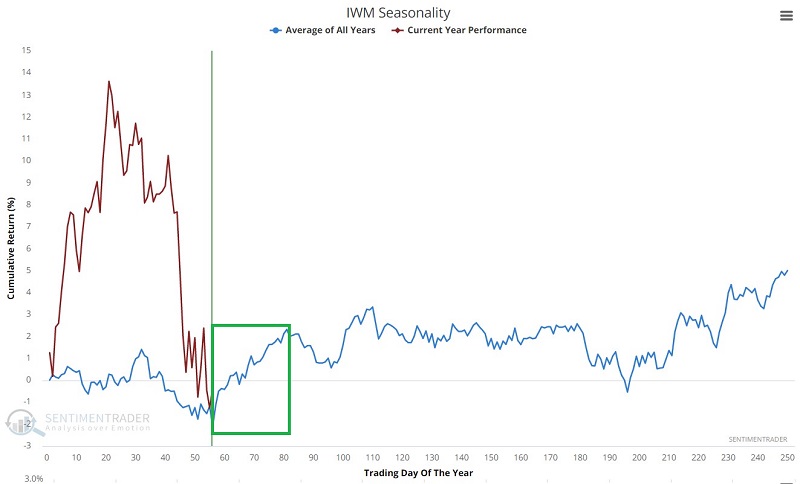
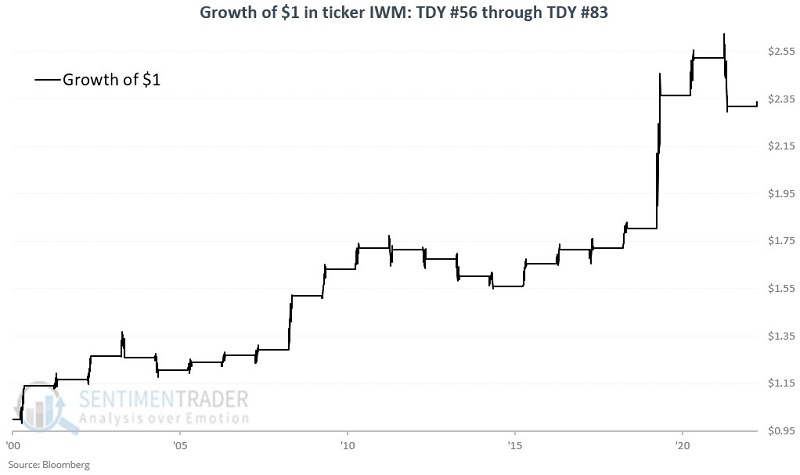
The chart and table below display the growth of $1 invested in ticker IWM only during the TDY #56 through TDY #83 period every year since 2001 and a performance summary.

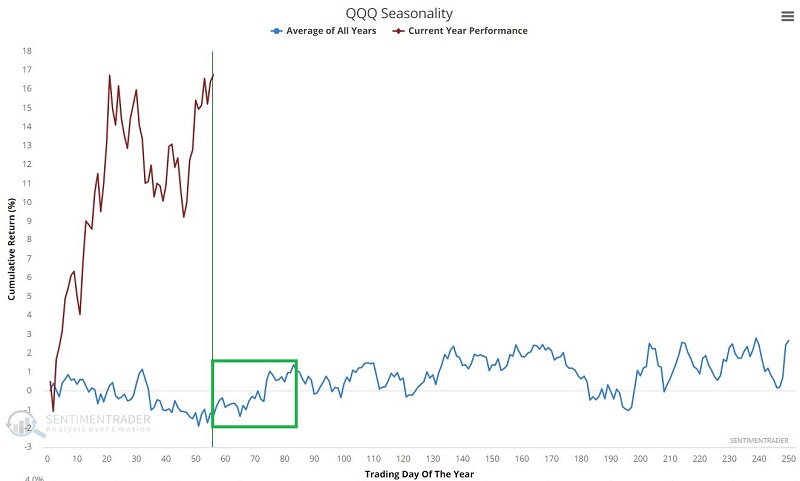
Tracking the Nasdaq 100 Index via ticker QQQ

The Invesco QQQ Trust ETF (ticker QQQ) is designed to track the daily price changes for the Nasdaq 100 Index. The chart below displays the annual seasonal trend for ticker QQQ.

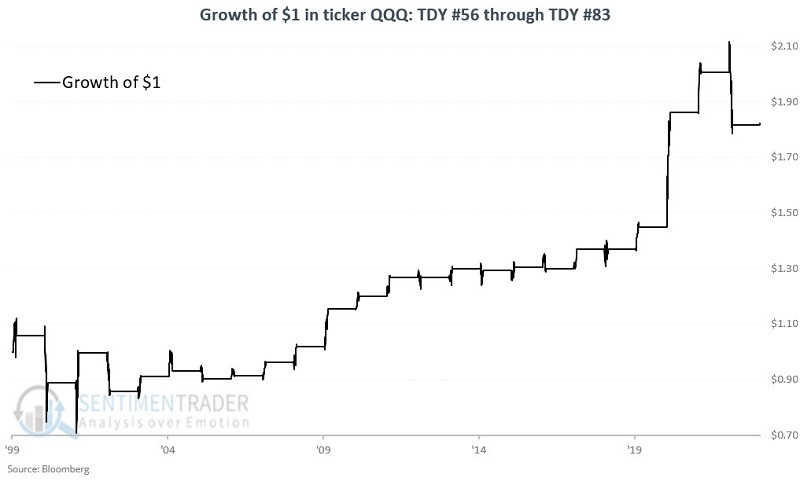
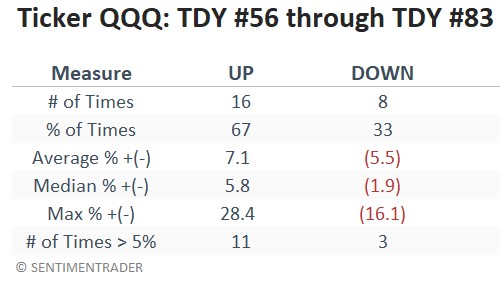
The chart and table below display the growth of $1 invested in ticker QQQ only during the TDY #56 through TDY #83 period every year since 1999 and a performance summary.

What the research tells us…

The stock market seems to presently be stuck in neutral. On the positive side, we have seen many breadth and sentiment indicators flashing favorable signals starting as long ago as June 2022. Meanwhile, the outlook for the overall economy remains clouded at best. At this point, price action is essentially the "swing vote." As we saw above, seasonality suggests that price has better than average odds of breaking to the upside over the next several weeks. Nevertheless, seasonality is "climate, not weather," and results can vary widely from year-to-year. The bottom line: if price is going to break to the upside, it may be soon or never. Investors should be watching closely for confirmation one way or the other.

PRODUCTS
SentimenTrader
Trading Tools
Indicators & Data API
‍
Strategies & Scanner
‍
Research Reports
FREE
RESOUrCES
Simple Backtest
Calculator
Simple Seasonality
Calculator
The Kelly Criterion
Calculator
Sentiment Geo Map
‍
Public Research Reports
‍
Education
Sentiment Indicators
‍
Technical Indicators
‍
Pricing
Bundle pricing
‍
FAQ
‍
Announcements
‍
COMPANY
‍
About
‍
In the News
‍
Testimonials
‍
Client Success Stories
CONTACT
‍
General Inquiries
‍
Media Inquiries
‍
Financial Professionals Inquiries
‍
© 2026 Sundial Capital Research Inc. All rights reserved.
Setsail Marketing
TermsPrivacyAffiliate Program
Risk Disclosure: The information and tools provided are for research and analytical purposes only and are not intended as investment advice. Market analysis involves uncertainty, and outcomes may differ from expectations. Users should conduct their own due diligence and consider their individual circumstances before making any financial decisions. Past performance is not necessarily indicative of future results.

Hypothetical Performance Disclosure: Hypothetical performance results have many inherent limitations, some of which are described below. No representation is being made that any account will or is likely to achieve profits or losses similar to those shown; in fact, there are frequently sharp differences between hypothetical performance results and the actual results subsequently achieved by any particular trading program. One of the limitations of hypothetical performance results is that they are generally prepared with the benefit of hindsight. In addition, hypothetical trading does not involve financial risk, and no hypothetical trading record can completely account for the impact of financial risk of actual trading. for example, the ability to withstand losses or to adhere to a particular trading program in spite of trading losses are material points which can also adversely affect actual trading results. There are numerous other factors related to the markets in general or to the implementation of any specific trading program which cannot be fully accounted for in the preparation of hypothetical performance results and all which can adversely affect trading results.

Testimonial Disclosure: Testimonials appearing on this website may not be representative of other clients or customers and is not a guarantee of future performance or success.