
Unleaded may run out of gas

Key points
- The price of Unleaded Gas futures is essentially unchanged from where it was two and a half years ago
- While price has been trying recently to work higher, Unleaded Gas is entering its weakest time of year
- A recent development in crude oil pricing is also flashing a yellow flag for Gas
Unleaded Gas price action is mixed
The chart below displays price action for Unleaded Gas futures. The black horizontal line illustrates that the current price is essentially unchanged from where it was in early 2022.
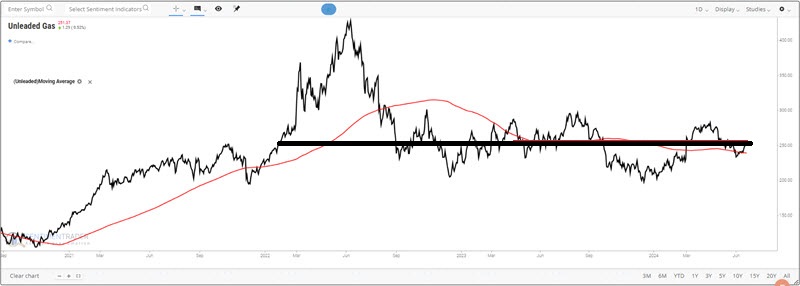
The good news is that the price is presently above its 200-day moving average (the red line in the chart above), which technically can be designated as an uptrend. On the other hand, the black horizontal line illustrates that the current price is essentially unchanged from where it was in early 2022, and the 200-day moving average has yet to turn back up.
The bottom line is that price action is mixed, and depending on how one looks at things, one can make a bullish or bearish argument. A more relevant point for the remainder of this discussion is that if Unleaded Gas breaks down below its 200-day moving average, price, and seasonal action will be aligned to the negative side.
Unleaded Gas is entering a significant seasonal period (and not in a good way)
The chart below displays the annual seasonal trend for Unleaded Gas futures.
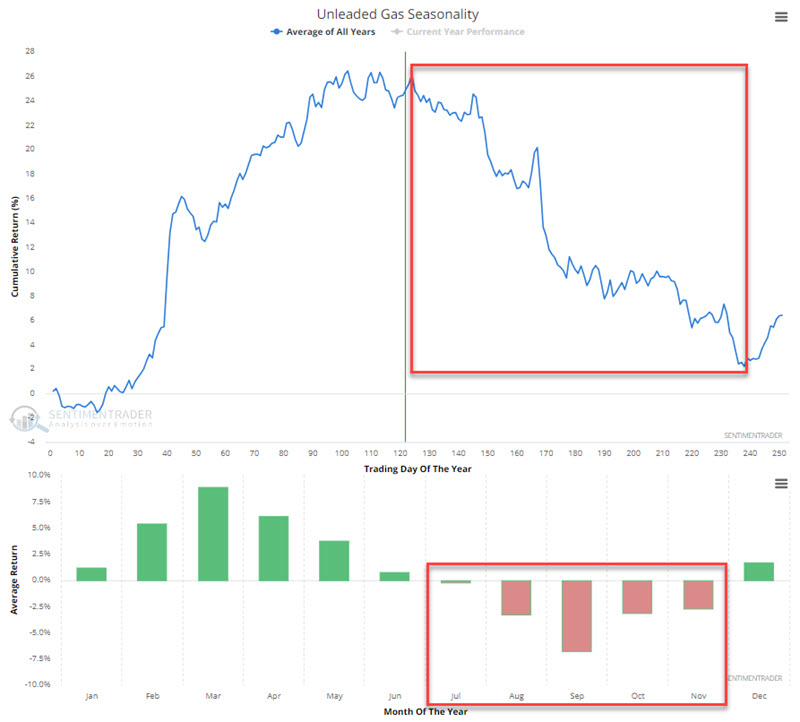
Trading Day of the Year (TDY) #124 through TDY #238 is highlighted in the red box in the upper click. For 2024, this period extends from the close on 2024-06-24 through 2024-12-02. Also, note in the lower clip that July through November has historically been weak. Does this imply that unleaded gas prices will fall in a straight nonstop between now and early December? Not at all. It suggests that traders should look for opportunities to play the short side of the market between now and then.
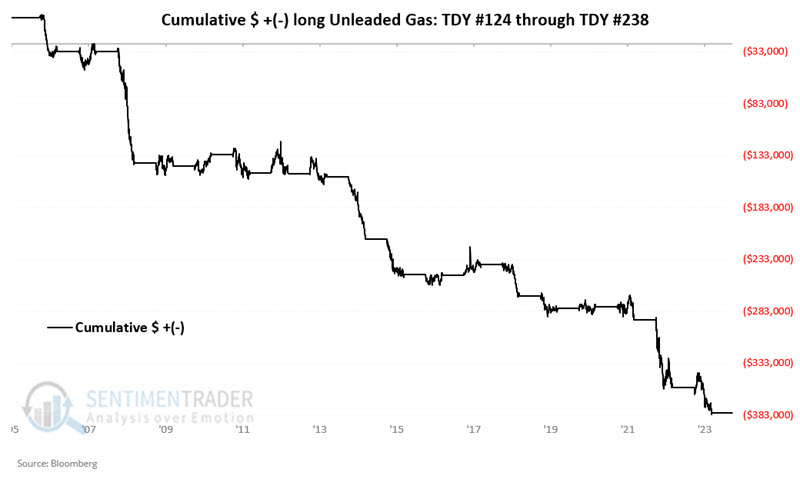
To illustrate the typical nature of Unleaded Gas performance during this period, the chart below displays the hypothetical cumulative $ +(-) achieved by holding a long position in unleaded gas futures only from TDY #124 through TDY #238 since 2007. The results speak for themselves.
The table below summarizes unleaded gas performance during this seasonally unfavorable period.
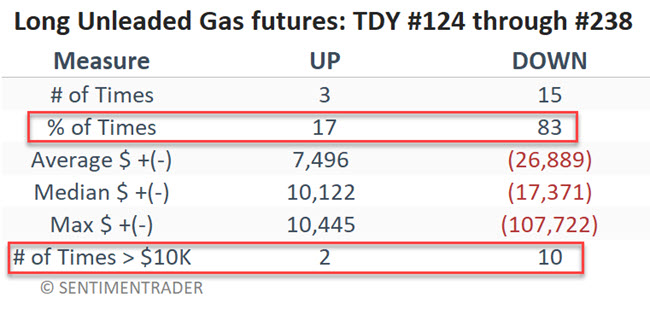
On the plus side, during two years (2010 and 2017), Unleaded Gas futures gained over $10,000 in value during this purportedly unfavorable period. So, please do not discount the potential for a sizeable rally as long as the price exceeds its 200-day moving average. Nevertheless, the overall results have been decidedly unfavorable - with a 17% Win Rate and moves of $10K or more skewing to the downside by a factor of 10 to 2.
Crude Oil Term Structure is another potential factor
The term structure of crude oil futures shows the relationship of the near-term futures contract to a further-out contract. If it is above 1.0, the near-term contract is priced higher than the further-out contract, called backwardation.
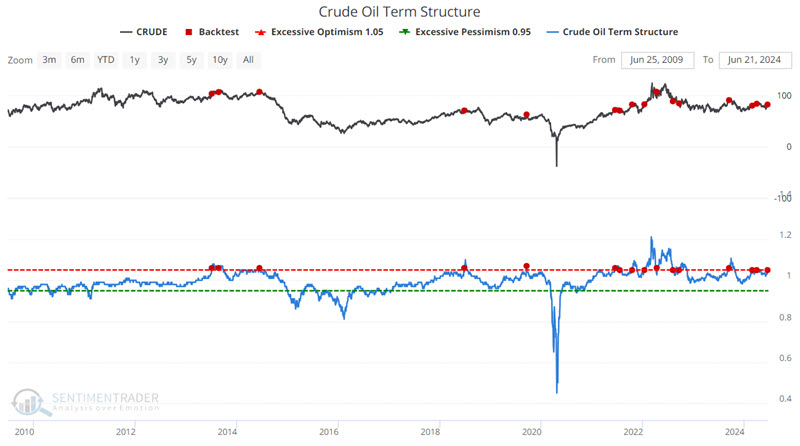
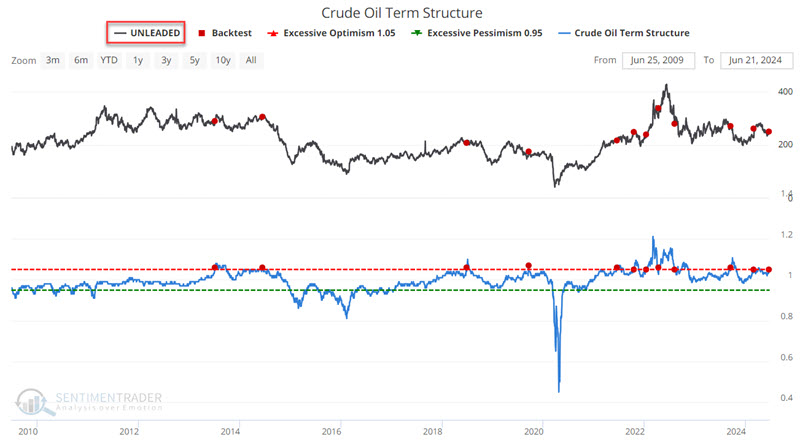
The chart below shows the dates when the Crude Oil Term Structure crossed above 1.05 for the first time in 21 days in the last 15 years.
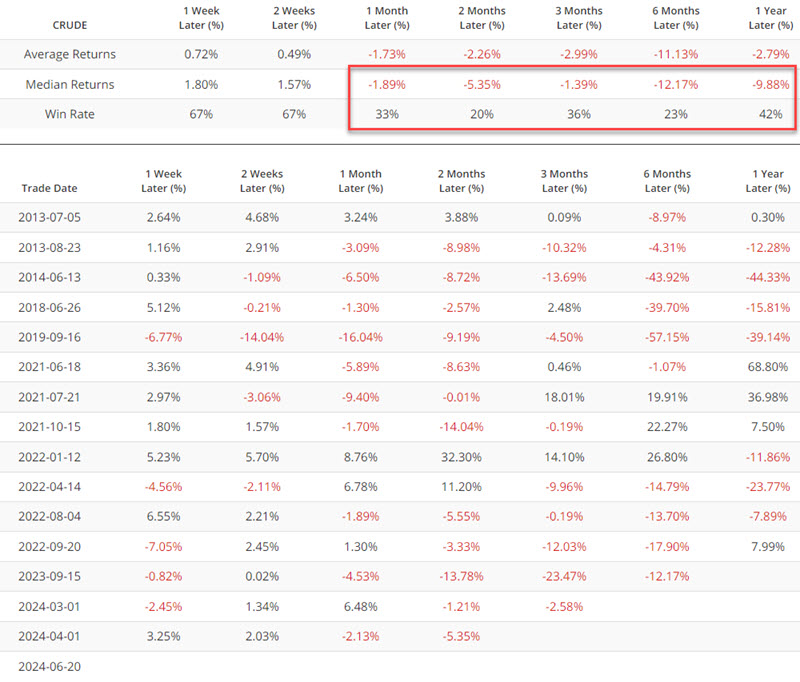
The table below summarizes crude oil futures performance and displays signal-by-signal results.
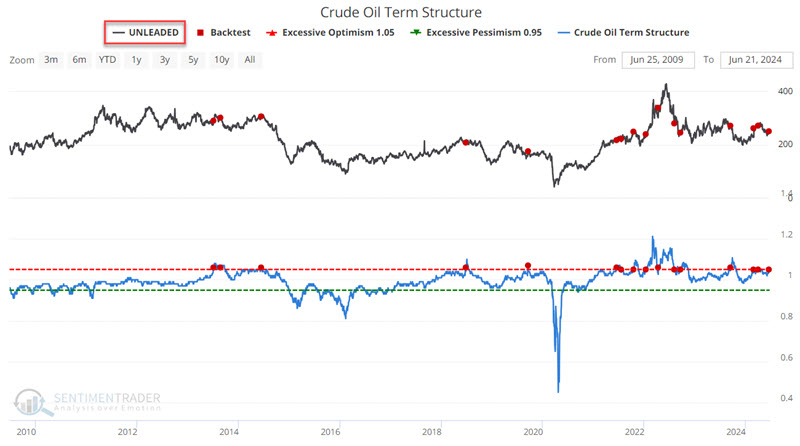
So, what does this have to do with Unleaded Gas? Crude and unleaded typically trade with a correlation of somewhere in the 80 to 85% range. So, it is not much of a stretch to suggest that what affects crude oil also affects Unleaded Gas. The chart below uses Unleaded Gas futures as the index and again shows the dates when the Crude Oil Term Structure crossed above 1.05 for the first time in 21 days in the last 15 years.
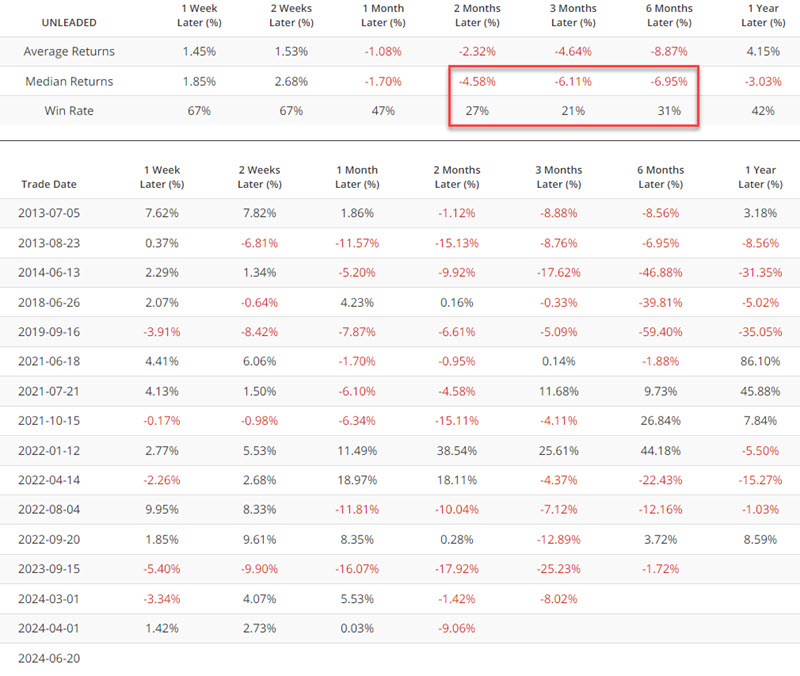
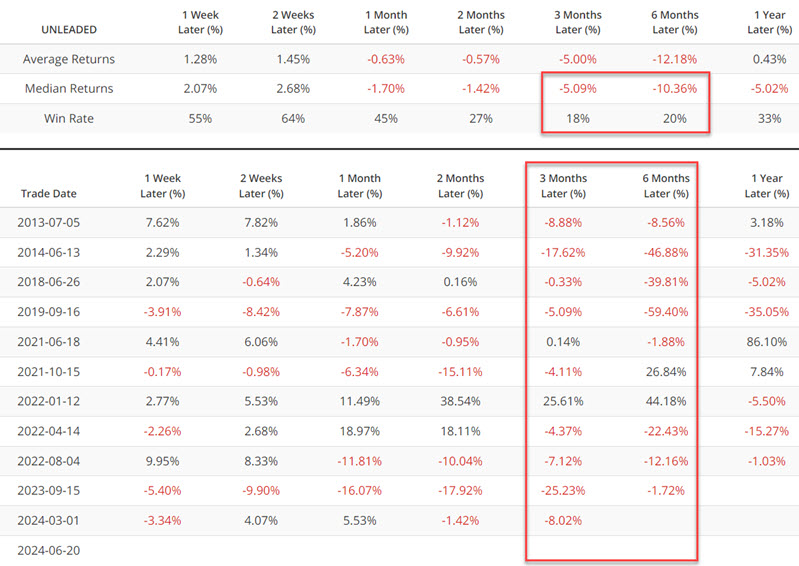
The table below summarizes unleaded gas futures performance and displays signal-by-signal results, not the typically poor performance during the two to six months after a signal.
The test below removes some overlapping signals by excluding signals within two months of the previous signals.
The table below shows particularly unfavorable results six months after a signal.
Putting Unleaded Gas Seasonality and Crude Oil Term Structure together
The current situation involves Unleaded Gas seasonality entering the unfavorable TDY #124 to TDY #238 period and Crude Oil's Term Structure crossing above 1.05 for the first time in two months. Let's look at previous times when this combination has been in effect.
The indicators:
A = If Unleaded Gas is between TDY #124 and #238 then A = -2 else A = 0
B = If Crude Oil Term Structure crosses above 1.05, then B = -1 for 63 trading days
C = A + C
When both factors are in play simultaneously, this simple model will equal -3.
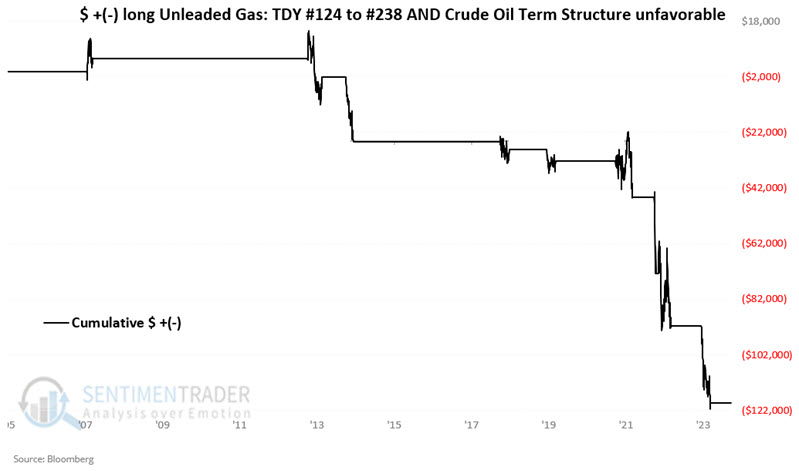
The chart below displays the hypothetical cumulative $ +(-) from holding a long position in Unleaded Gas futures only when the model reads -3.
The table below displays the start and end dates and start and end prices for periods when the model reads -3.
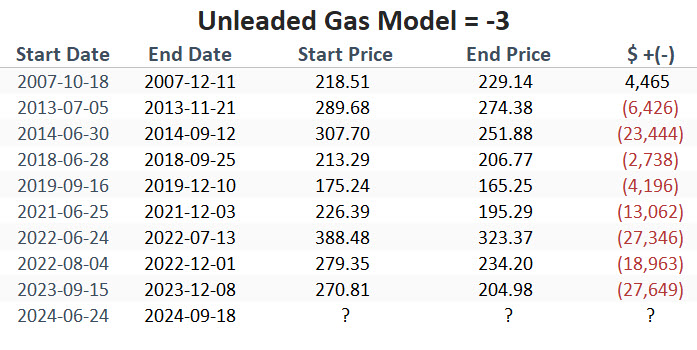
Finally, the table below summarizes Unleaded Gas performance only during periods when the Trading Day of the Year was between 124 and 238, AND the Crude Oil Term Structure indicator has crossed above 1.05 within the last 63 trading days.
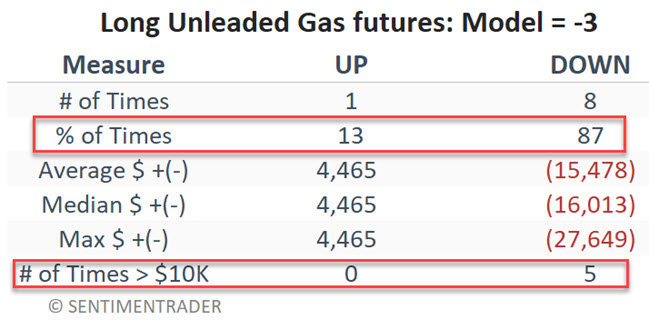
A new period of -3 readings will begin at the close on 2024-06-24 and will extend through at least 2024-09-18 (if the Crude Oil Term Structure Index drops below 1.05 and then crosses back above 1.05 in the meantime, this period could be extended through as late as 2024-12-02.
Once again, the overall historical results have been pretty dismal. Still, the 2007 period reminds us that anything can happen (i.e., Unleaded Gas could rally significantly) and that risk control is still the responsibility of the individual trader.
What the research tells us…
As long as Unleaded Gas futures prices hold above the 200-day moving average, there is a risk in fading a favorable price trend. However, given the persistently unfavorable nature of the seasonal period, we are now entering - especially when combined with the recent unfavorable signal from our Crude Oil Term Structure indicator - aggressive, well-capitalized traders should view any price weakness as a potential opportunity to play the short side of Unleaded Gas futures.