
Unleaded Gas may be Setting Up for a Reversal

Key points:
- In June 2025, this column discussed the potential for lower prices for unleaded gas
- Gas prices are now almost 20% lower than they were at that time
- Now, just as "low gas prices" are trending as a topic, sentiment and seasonality are suggesting the potential for a reversal higher
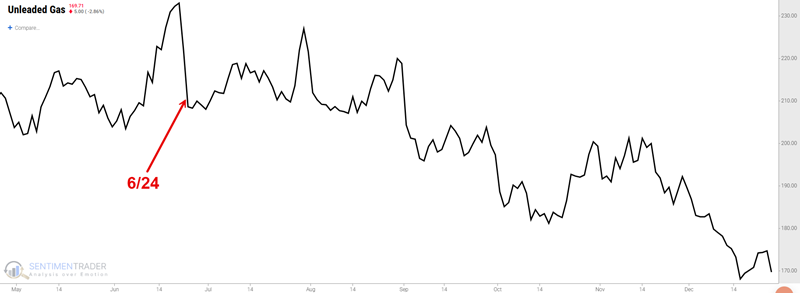
Unleaded Gas plunged in the second half of 2025
We are not in the business of "making predictions." Our job is to analyze data and report on it in an objective and unbiased manner. In late June 2025, the seasonal outlook for unleaded gas was extremely unfavorable. Coupled with an already unfavorable price trend, the outlook did not appear favorable, as noted in this piece dated June 25, 2025.
In the last six months of the year - and to the surprise of many who had warned of soaring inflation due to tariffs - unleaded gasoline prices plunged 20%.
However, the narrative may now be about to change.
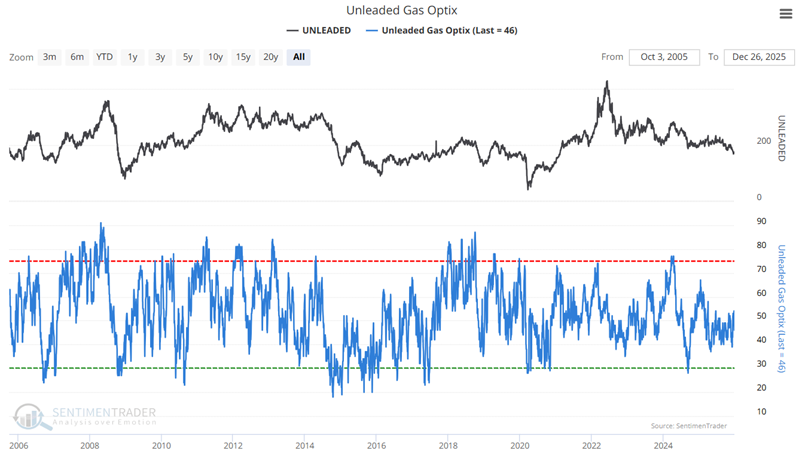
Unleaded Gas sentiment flashes a somewhat hidden signal
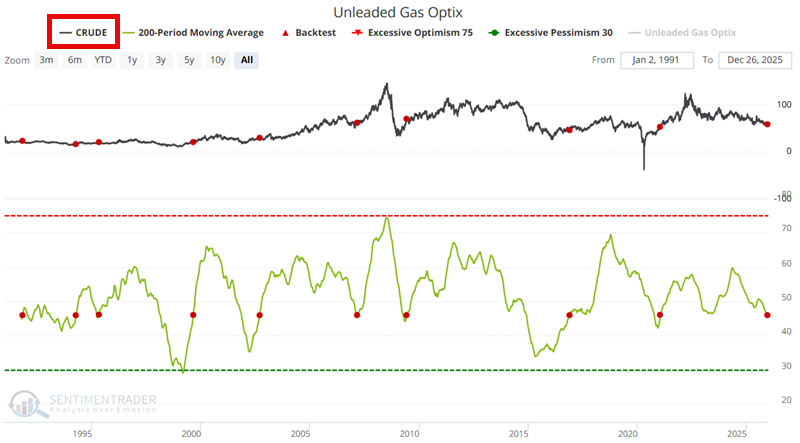
The chart below displays Unleaded Gas along with our Unleaded Gas Optix indicator. To the naked eye, there doesn't really seem to be anything noteworthy jumping out at the moment.
But let's take an alternate approach. The green line in the chart below represents the 200-day moving average of Unleaded Gas Optix. The red dots highlight those dates when the 200-day average crossed above 46%. The most recent signal occurred on December 24th.
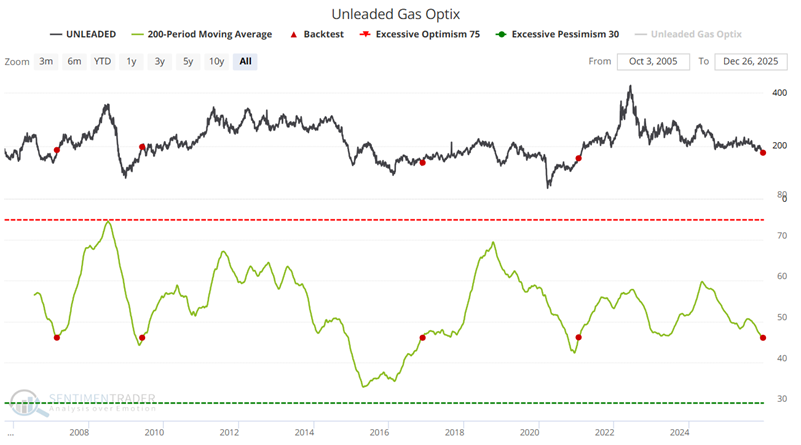
The table below summarizes Unleaded Gas' performance following the signals shown in the chart above.
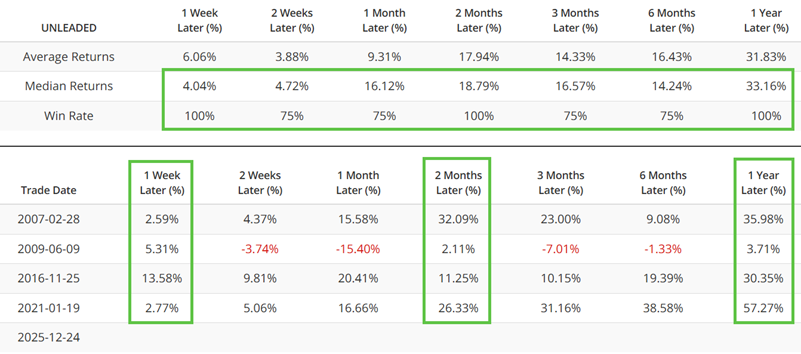
To put it mildly, the results above are compelling. That said, the sample size is too small to draw any definitive conclusions from, and it should not be assumed that the performance following the December 24th signal will automatically align with previous signal results. Still, it does suggest considering the potential for a significant shift in price action.
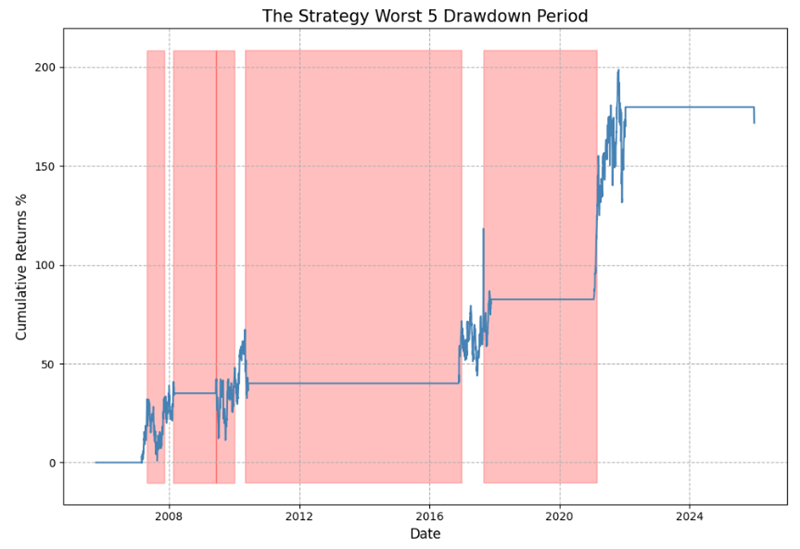
The chart below displays the hypothetical percentage gains and losses incurred over the 252 trading days (roughly one year) following the signals highlighted above. Note that while previous signals ultimately showed a gain, there has been considerable volatility along the way. So even if returns in the months ahead were to mirror the Median Returns in the table above, no one should expect "smooth sailing" in a market as volatile as Unleaded Gas.
Seasonality is also pointing to higher gas prices
The chart below displays the annual seasonal trend for Unleaded Gas futures. Note the strong propensity for strength during the first half of the year and weakness during the second half.
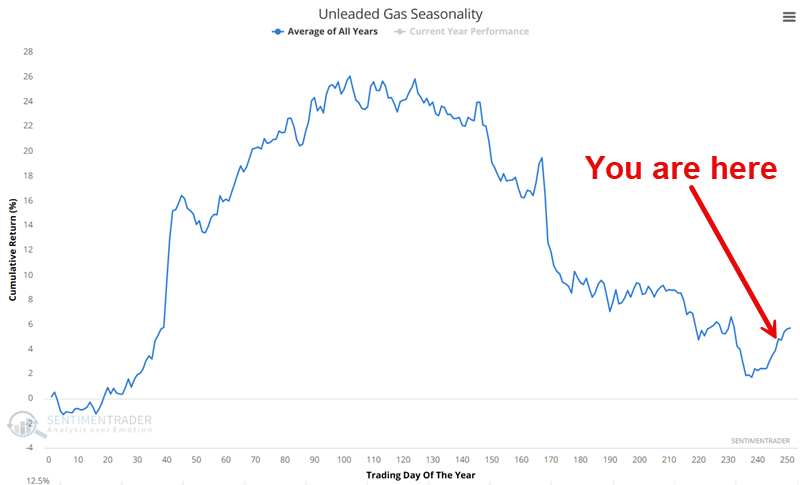
Note that annual seasonal trend charts represent an average of past events and do not serve as a roadmap for predicting future price performance in any given year. That said, it is worth noting that the 2025 performance closely followed the annual seasonal trend, with strength during the first half and significant weakness thereafter.
So, how is seasonality working out lately? From Trading Day of Year #145 through TDY #238 (July 24th through December 3rd), Unleaded Gas futures lost over 13% in value. The period from TDY #238 through TDY #2 in 2026 is deemed seasonally favorable. However, since December 3rd, Unleaded has quickly lost another 7% in value. The current favorable seasonal period ends on January 5th.
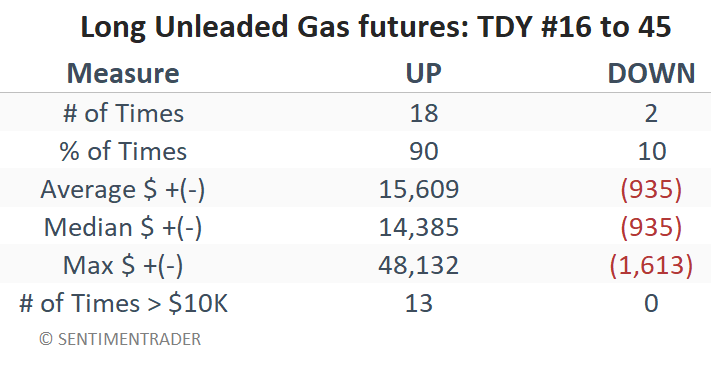
The next key favorable seasonal period extends from TDY #16 through TDY #45 in 2026 (January 23rd through March 5th). The chart below displays the hypothetical dollar gain/loss achieved by holding a long position in Unleaded Gas futures only during this period every year since 2005. Notice anything?
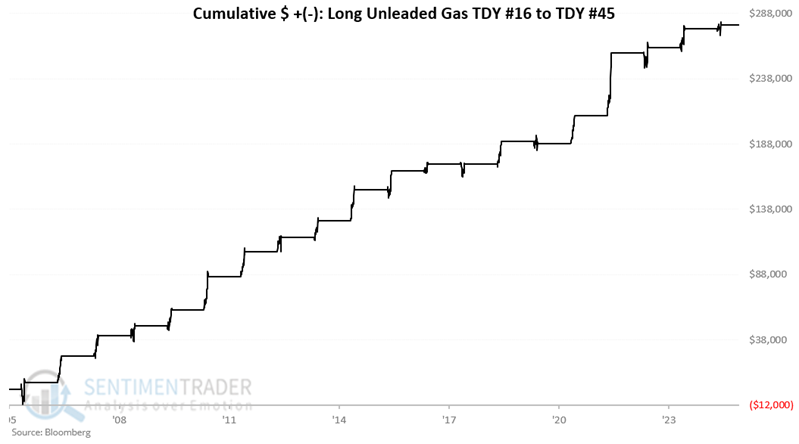
The table below summarizes Unleaded Gas performance during the TDY #16 to #45 period since 2005.
What about Crude Oil?
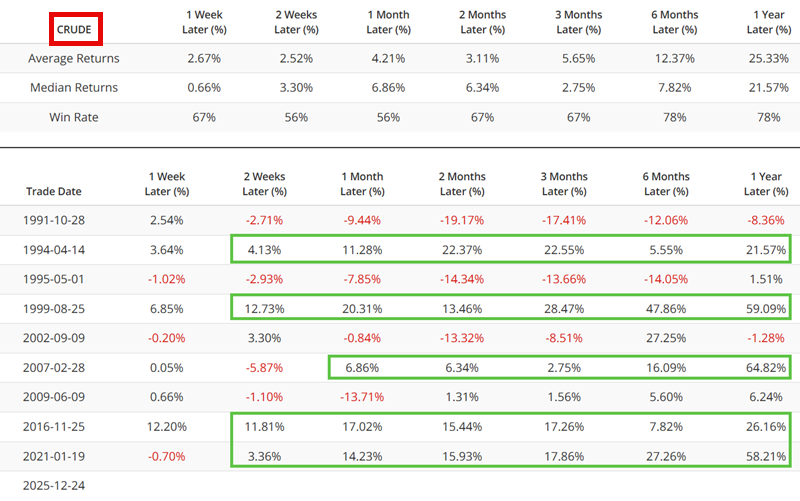
Unleaded Gas and Crude Oil are obviously highly correlated as one is a derivative of the other. Do you know if the test above has any relevance for crude? The chart below runs the same test using Crude Oil futures as the index.
The table below summarizes the results. As you can see, the overall results are more mixed. Still, the key takeaway is that on several occasions, our Unleaded Gas Optix signal has been followed by massive increases in the price of Crude Oil. Make of that what you will.
What the research tells us…
Unleaded Gas has shown itself to be a highly cyclical market, typically showing strength during the first half of the year and weakness during the second half. This bias does not guarantee an advance in the months ahead, but it does suggest that we should be prepared for the possibility. Likewise, the signal detailed above, based on a swing higher in the long-term average of our Unleaded Gas Optix, lends significant weight to the potential for a meaningful reversal of fortune. For traders, now is the time to prepare and decide on the criteria or setup that might trigger an entry on the long side of the Unleaded Gas market. Non-futures traders can gain exposure to Unleaded Gas price movements by purchasing shares of the United States Gasoline Fund LP ETF (ticker UGA) and to Crude Oil price movements by buying shares of the United States Oil Fund LP ETF (ticker USO) or the Invesco DB Oil Fund ETF (ticker DBO).