
Under the Radar Insider Clues in Four Sectors

Key points
- Bullish corporate insider activity is typically a favorable sign, particularly if concentrated within a given sector
- Our Corporate Insider Velocity indicators alert investors to important shifts in insider buying not visible simply by looking at raw buying and selling
- By measuring the rate of change in insider activity, we can often identify important clues regarding which sectors insiders view most favorably
- Focusing on insider activity within a given specific sector appears to offer a potential edge
Velocity indicators offer a look "under the radar"
For the S&P 500 Index, the Nasdaq 100 Index, and the individual S&P 500 sectors, we track insider buying and selling activity for the constituent stocks that comprise the index. We track separately buying, selling, the ratio of buying versus selling, and a unique measure we call "insider velocity."
This indicator shows the velocity of corporate insider buying versus selling in S&P 500 stocks. It takes a 4-week rate of change for insider buys and subtracts a 4-week rate of change for insider sales. The more positive the difference is, the more aggressively insiders are buying stock in their own companies, and the more positive it is for their particular sector, and potentially the overall market. This more extreme activity is typically a sign that insiders see an impending improvement in the fundamentals for their company. When this type of activity is widespread within a specific sector, it is typically worth taking a closer look, as it signals that insiders are betting with their own money that stock prices will be higher over the next one to three years.
We've noticed some important shifts in the urgency of insider buying recently. Let's take them one at a time.
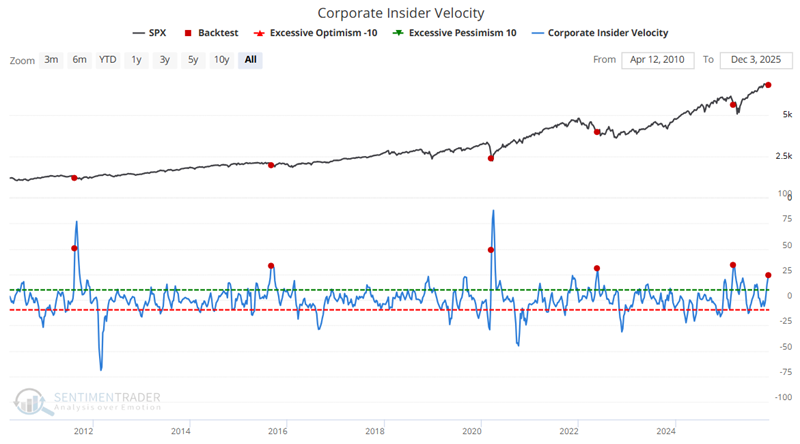
Index #1: S&P 500 Index
Our Corporate Insider Velocity indicator analyzes buying and selling activity by corporate insiders among the 500 stocks that comprise the S&P 500 index. The chart below highlights all weeks when the indicator crossed above 24. The most recent signal occurred on December 1st.
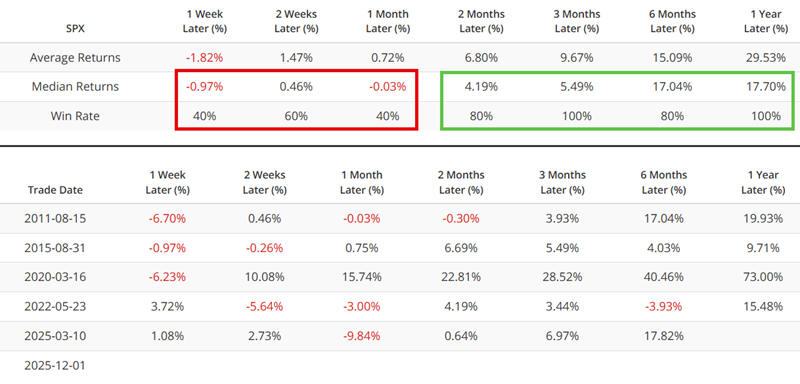
The table below summarizes the subsequent performance of the S&P 500 index. Initial results have been spotty, but six and twelve-month returns have been solid.
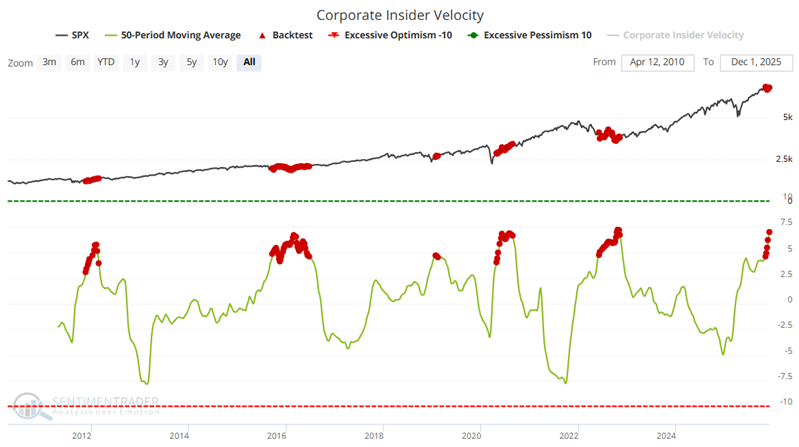
This data can be used in different ways. For example, the chart below uses a 50-week moving average of the Corporate Insider Velocity indicator and highlights all weeks when the 50-week average was above 5.
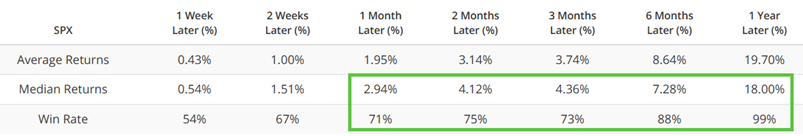
The table below summarizes the subsequent performance of the S&P 500 index.
This period tends to highlight periods when S&P 500 insiders are accumulating shares. The latest flurry of signals suggests that insiders have been buying since early November.
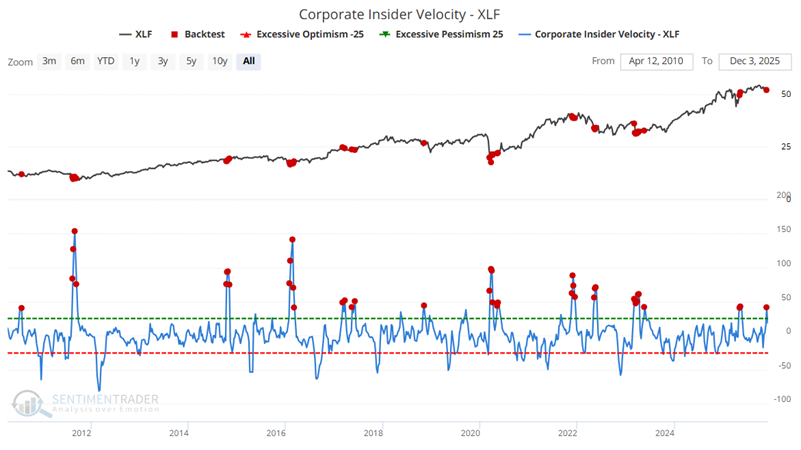
Index #2: Financial Index (XLF)
Our Corporate Insider Velocity - XLF indicator considers buying and selling activity by corporate insiders in the stocks that comprise the S&P 500 Financials Index. The chart below highlights all weeks when the indicator was above 40, including overlapping signals. The most recent signal occurred on November 24th.
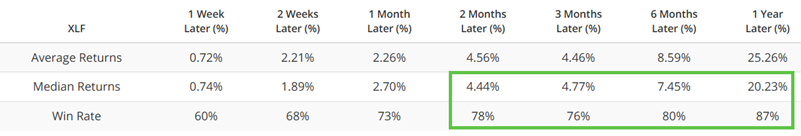
The table below summarizes the subsequent performance of ticker XLF.
Note that these signals are not part of a "sure thing" trading system. They merely highlight the fact that the people who know these companies best are putting their own money to work in their own stock shares. This adds weight to the favorable side of the weight of the evidence ledger.
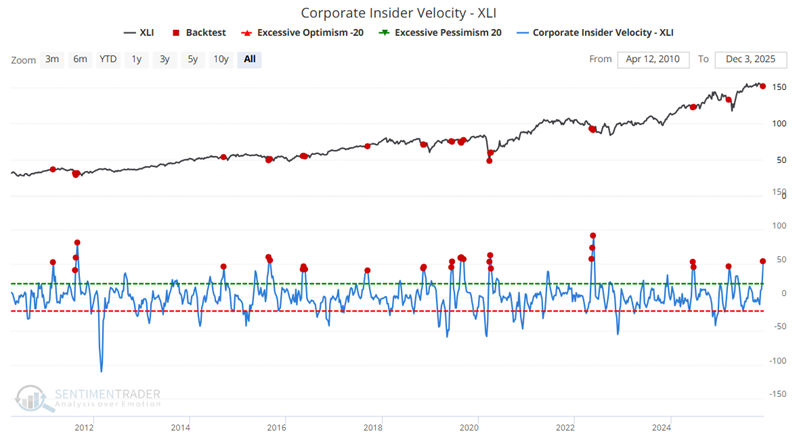
Index #3: Industrials Index (XLI)
Our Corporate Insider Velocity - XLI indicator considers buying and selling for corporate insiders from the stocks that comprise the S&P 500 Industrials Index. The chart below highlights all weeks when the indicator was above 40, including overlapping signals. The most recent signal occurred on December 1st.
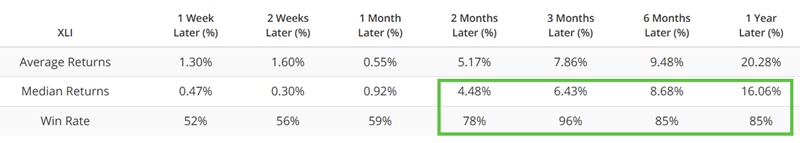
The table below summarizes the subsequent performance of ticker XLI.
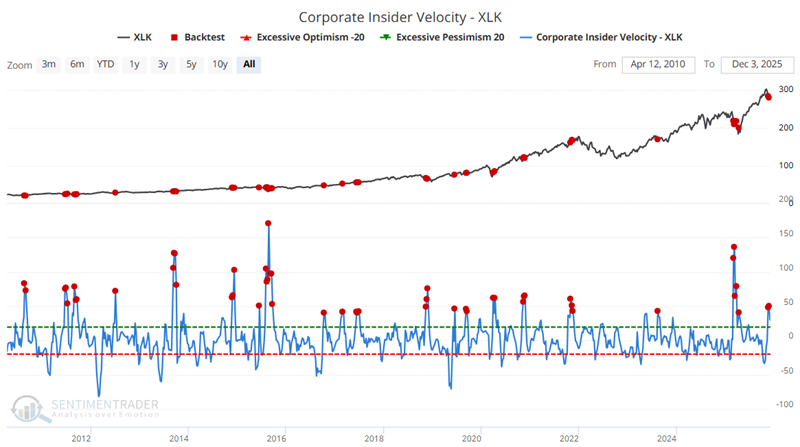
Index #4: Technology Index (XLK)
Our Corporate Insider Velocity - XLK indicator considers buying and selling for corporate insiders from the stocks that comprise the S&P 500 Information Technology Index. The chart below highlights all weeks when the indicator was above 40, including overlapping signals. The most recent signal occurred on November 24th.
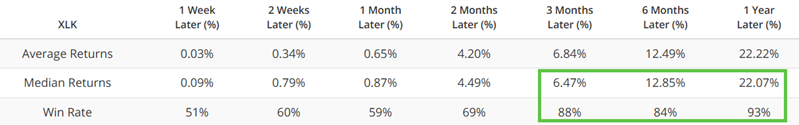
The table below summarizes the subsequent performance of the ticker XLK.
Note that insider activity can sometimes be early. The signals in 2021 were followed by one-year declines of 20% or more. This is a reminder of why we view these signals as "weight of the evidence" and not as a "trading system."
Index #5: Consumer Discretionary Index (XLY)
Our Corporate Insider Velocity - XLY indicator considers buying and selling for corporate insiders from the stocks that comprise the S&P 500 Consumer Discretionary Index. The chart below highlights all weeks when the indicator was above 40, including overlapping signals. The most recent signal occurred on December 1st.
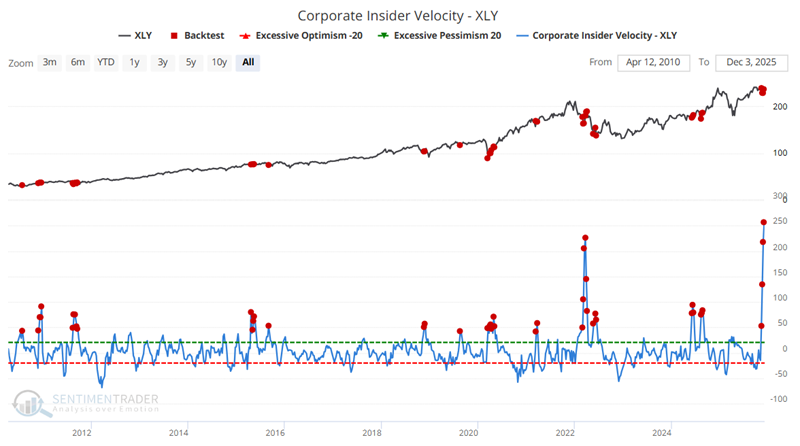
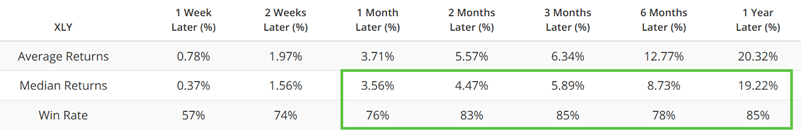
As you can see from the chart, the indicator value rocketed higher in recent weeks. Is this a sure thing buy signal? No. But it is a clear sign of aggressive activity on the part of industry insiders. The table below summarizes the subsequent performance of ticker XLY.
What the research tells us…
When bullish insider action is abundant within a given sector, there is a higher probability of good performance for that sector over the next year (and possibly longer). Our insider "Velocity" indicator provides a glimpse "under the radar" at the aggressiveness - or lack thereof - with which insiders across a given index or sector are buying or selling. The sectors highlighted above are not guaranteed to trend higher. The only thing we know for sure is that individuals most familiar with those industries have recently moved aggressively to the buy side and/or away from the sell side. Ultimately, the only reason they would do so is that they expect improved fundamentals/earnings, and anticipate their company's stock to rise as a result.
As always, insider activity indicators should not be thought of as "trading systems" that generate specific buy and sell timing signals. Instead, they serve as important "weight of the evidence" and alert us to situations where the people who know their company and industry best are seeing exceptional value.