
Uncovering Market Potential from Metal Ratios in a Monetary Easing Cycle

Key Points:
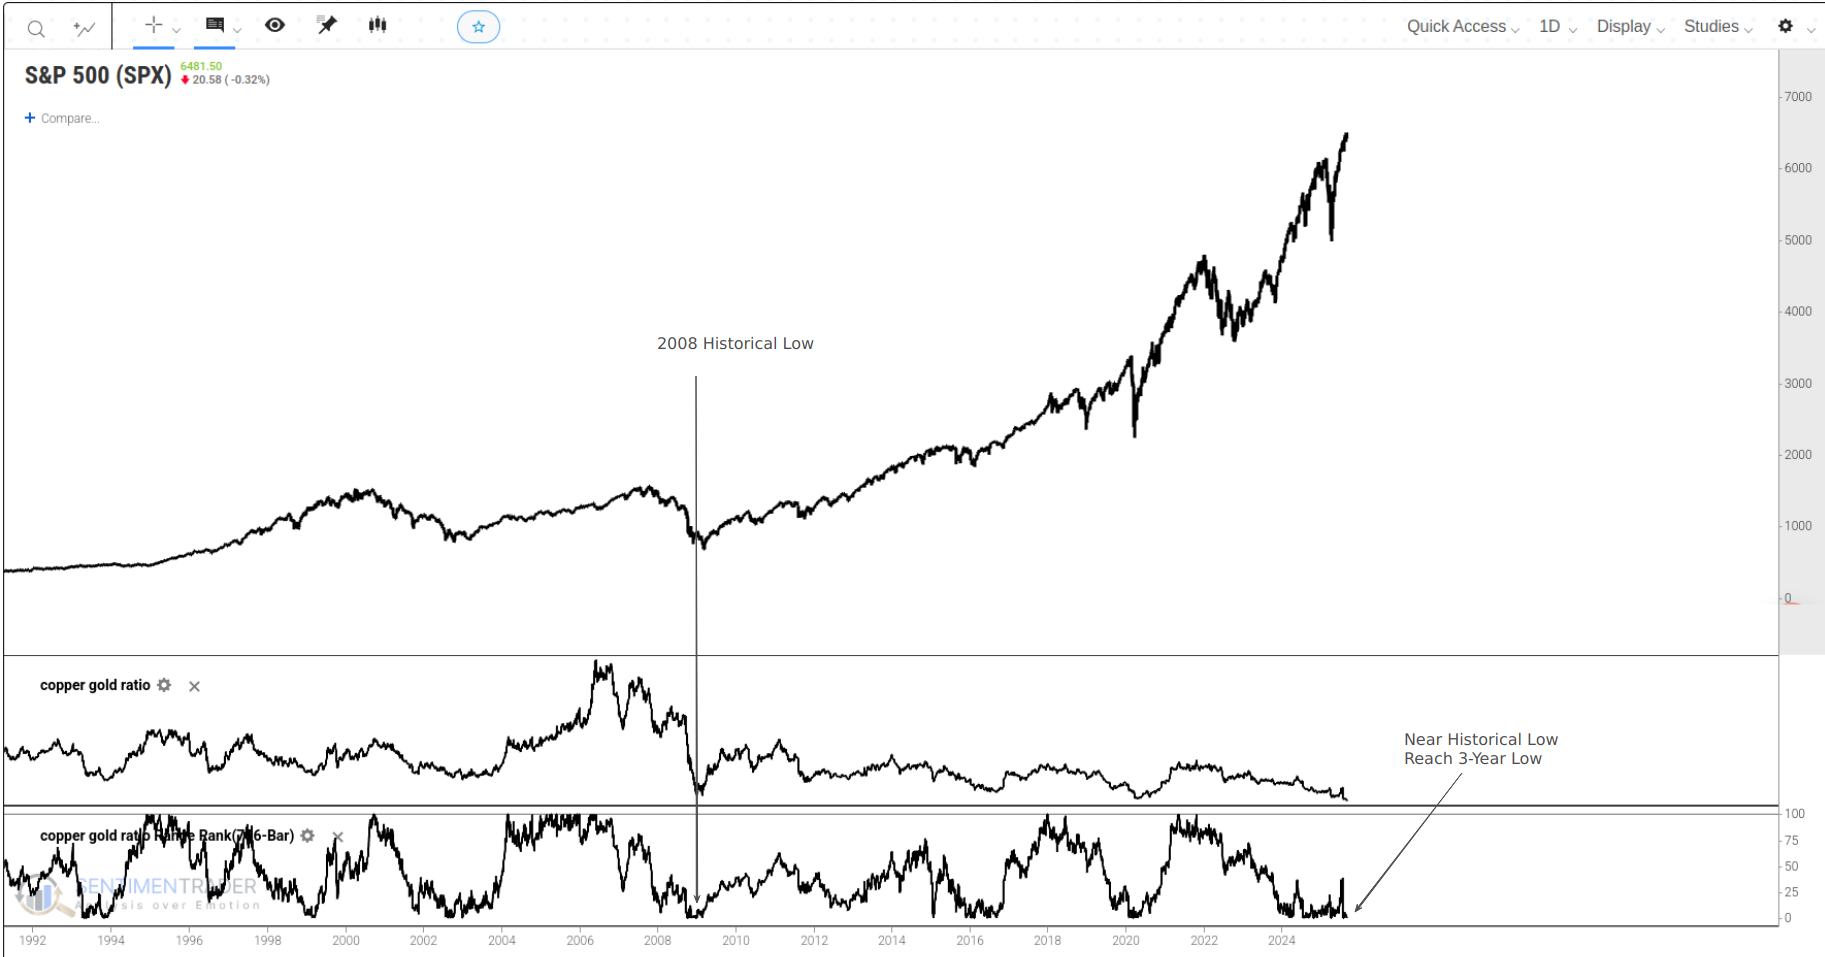
- The bottoming of the copper-gold ratio does not signal a reliable recession warning; instead, the stock market demonstrates exceptional upward resilience over the next year.
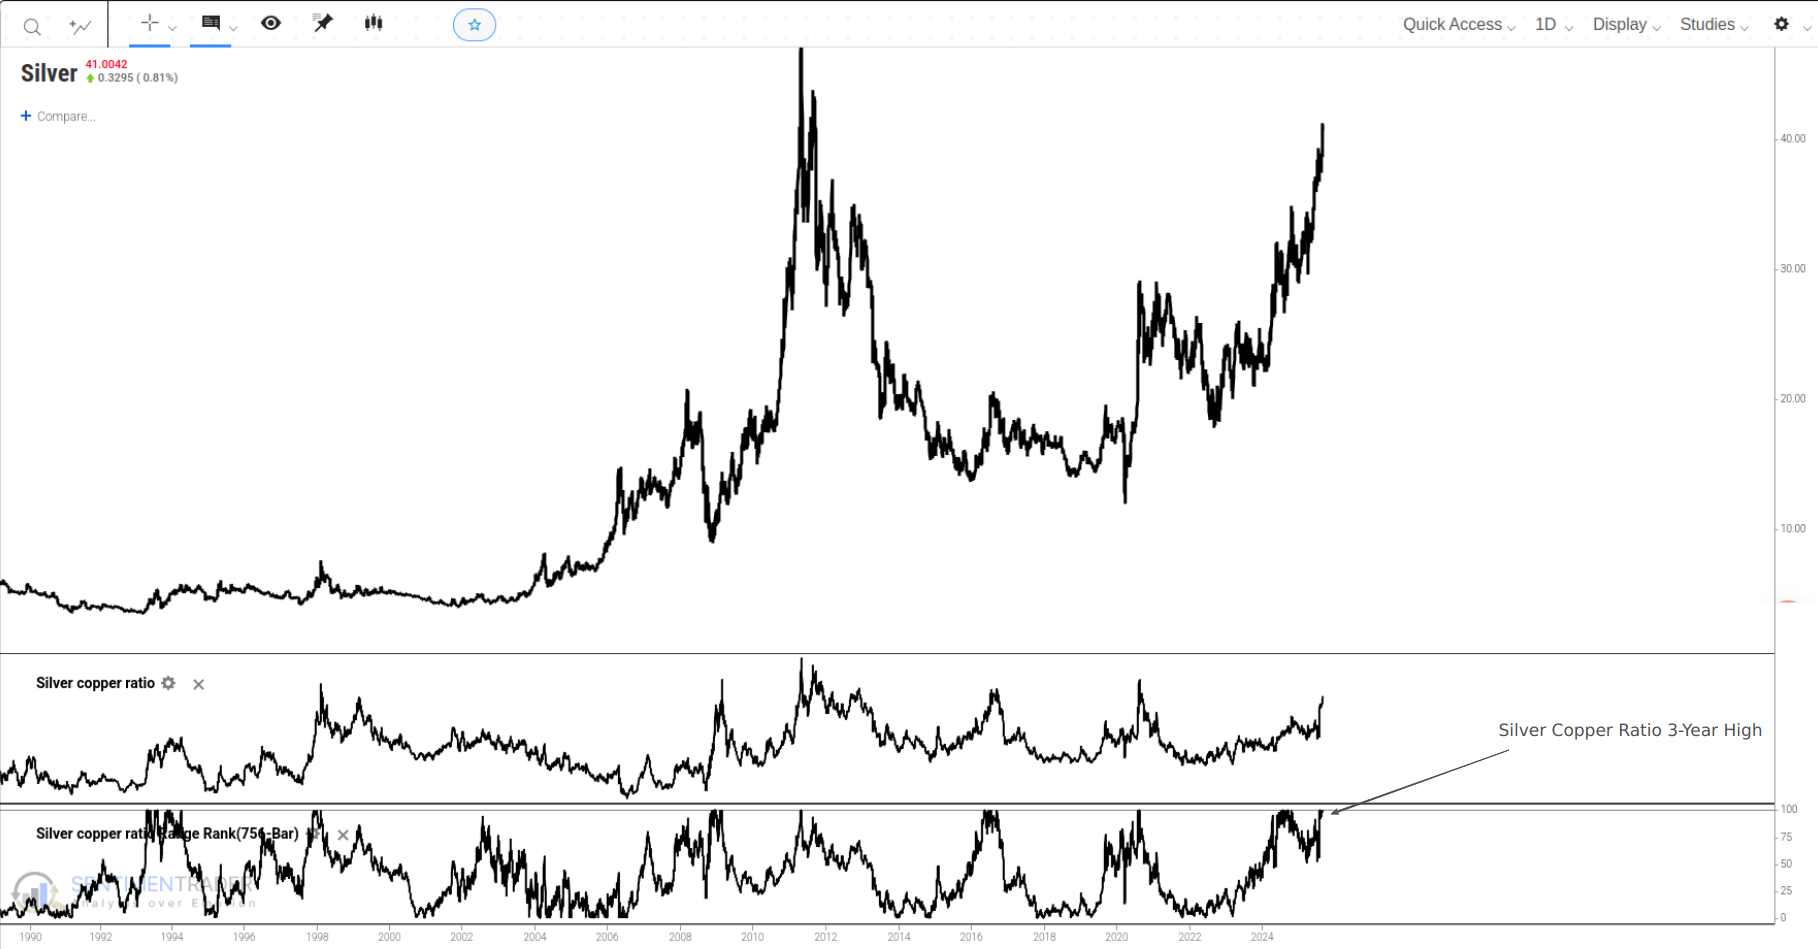
- The silver-copper ratio surges as silver, possessing both industrial demand and financial attributes, currently exhibits stronger fundamentals than traditional copper.
- The signals reveal a clear rotation pattern: capital flows into growth sectors and precious metals while exiting traditional defensive sectors.
The Economy's "False Alarm" and the Market's True Path
Market analysts are fond of viewing the Copper/Gold ratio as the EKG of the real economy. In theory, the price of copper reflects the pulse of industrial activity, while gold is the ultimate expression of safe-haven sentiment. Therefore, when this ratio hits a trough-such as the "all-time low" we see today-a loud alarm seems to sound: recession is imminent, and a winter for risk assets is coming. However, this seemingly impeccable theory crumbles when tested against historical data.
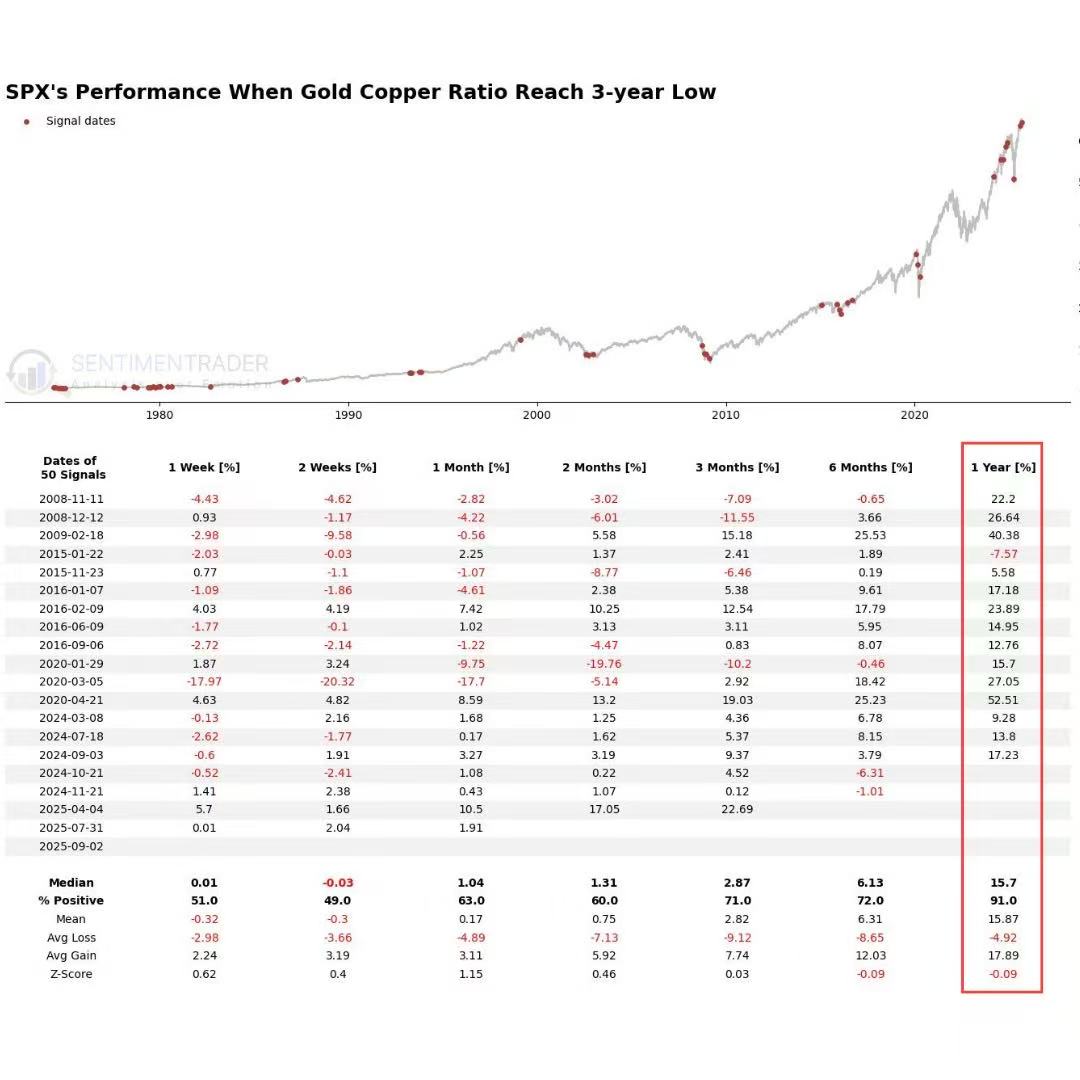
Most investors worry that such a signal of economic anxiety will translate directly into a stock market sell-off. But the data (c_g ratio spx) paints a completely different picture. After a signal triggers from a low in the Copper/Gold ratio, the S&P 500 may indeed experience some short-term turbulence, but its long-term resilience is astonishing. One year after a signal, the index's probability of a gain is as high as 91%, with a robust median return of 15.7%. This is in stark contrast to the "economic collapse" narrative. Clearly, the market has not taken this so-called "alarm" as a reason to sell. Backtest Details Click Here.
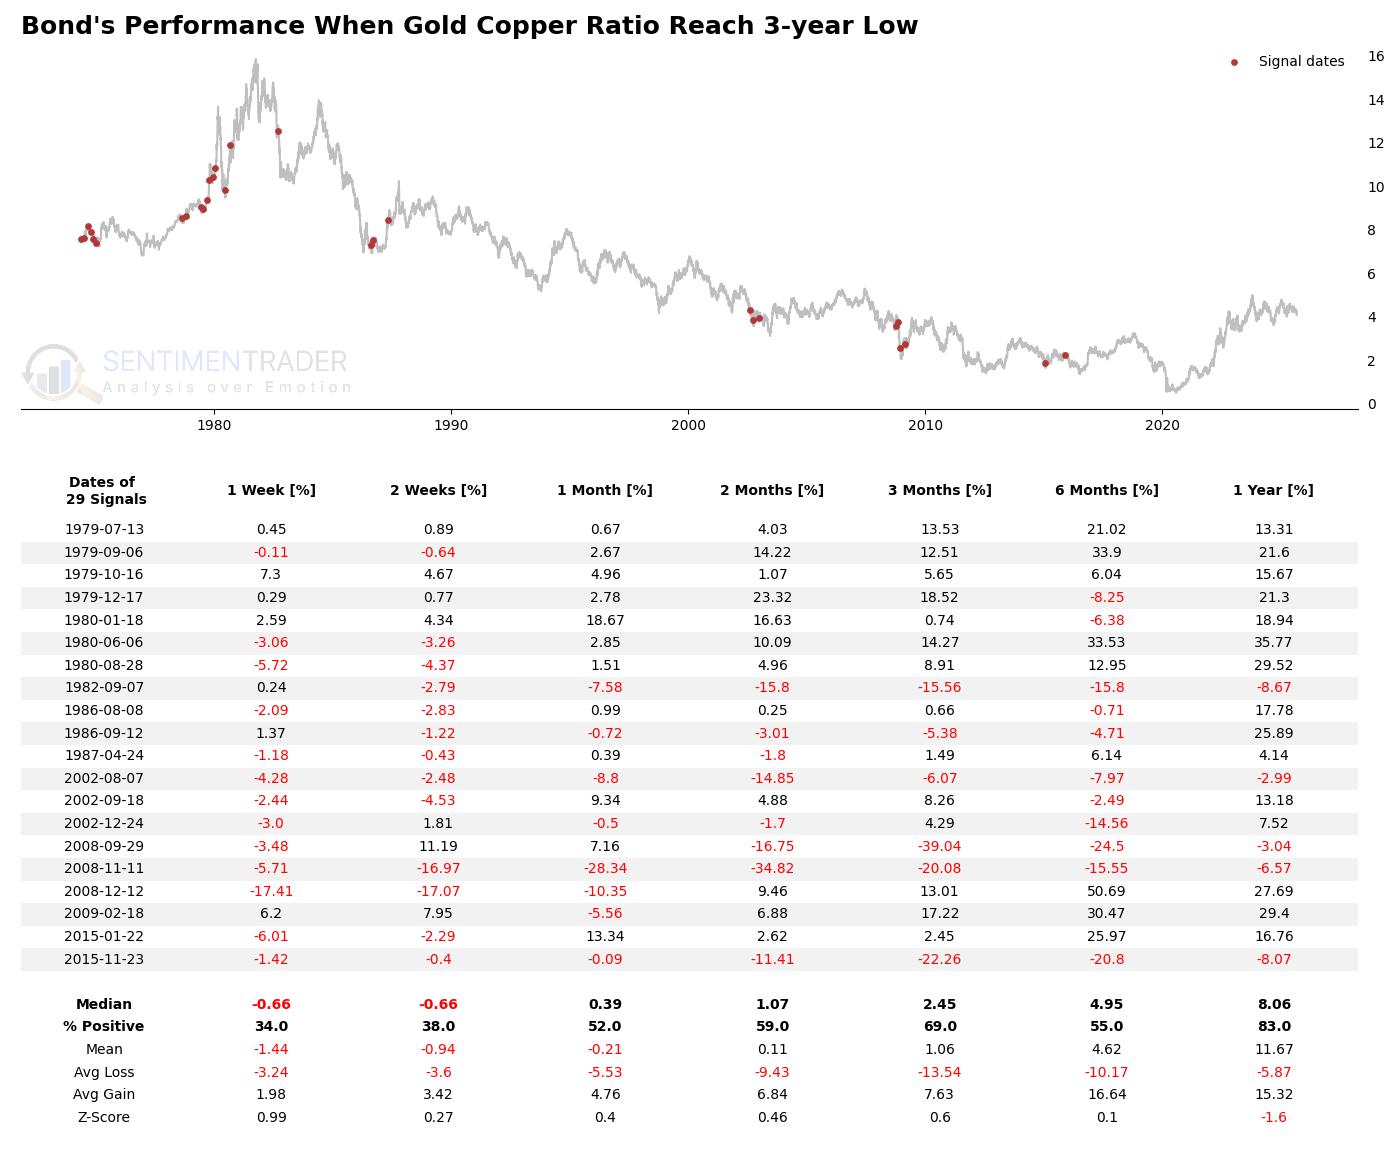
What about the bond market? If the economy were truly in peril, capital should be flooding into bonds for safety. The data shows a more complex situation. Although the probability of a gain in bond prices one year later is 63%, the returns are extremely volatile, and the Z-Score is negative, indicating that this performance is no better than a random period. This suggests the signal cannot be simply equated to a clear "buy bonds" directive. The driving forces behind it are far more complex than a mere "flight to safety" and are likely more related to inflation expectations and the monetary policy path. Backtest Details Click Here.
"Financial Over Physical," or "Easing Ignites Everything"?
If the Copper/Gold ratio is a misread alarm, then the surge in the Silver/Copper ratio-like the recent breakout to a four-year high-is more like a powerful testament to the market's core drivers. The popular interpretation of this ratio is the ultimate showdown between "financial attributes" and "industrial attributes," and its surge is seen as definitive proof of capital fleeing the real economy for financial and monetary assets.
So, when this signal appears, how do the metals in question perform?
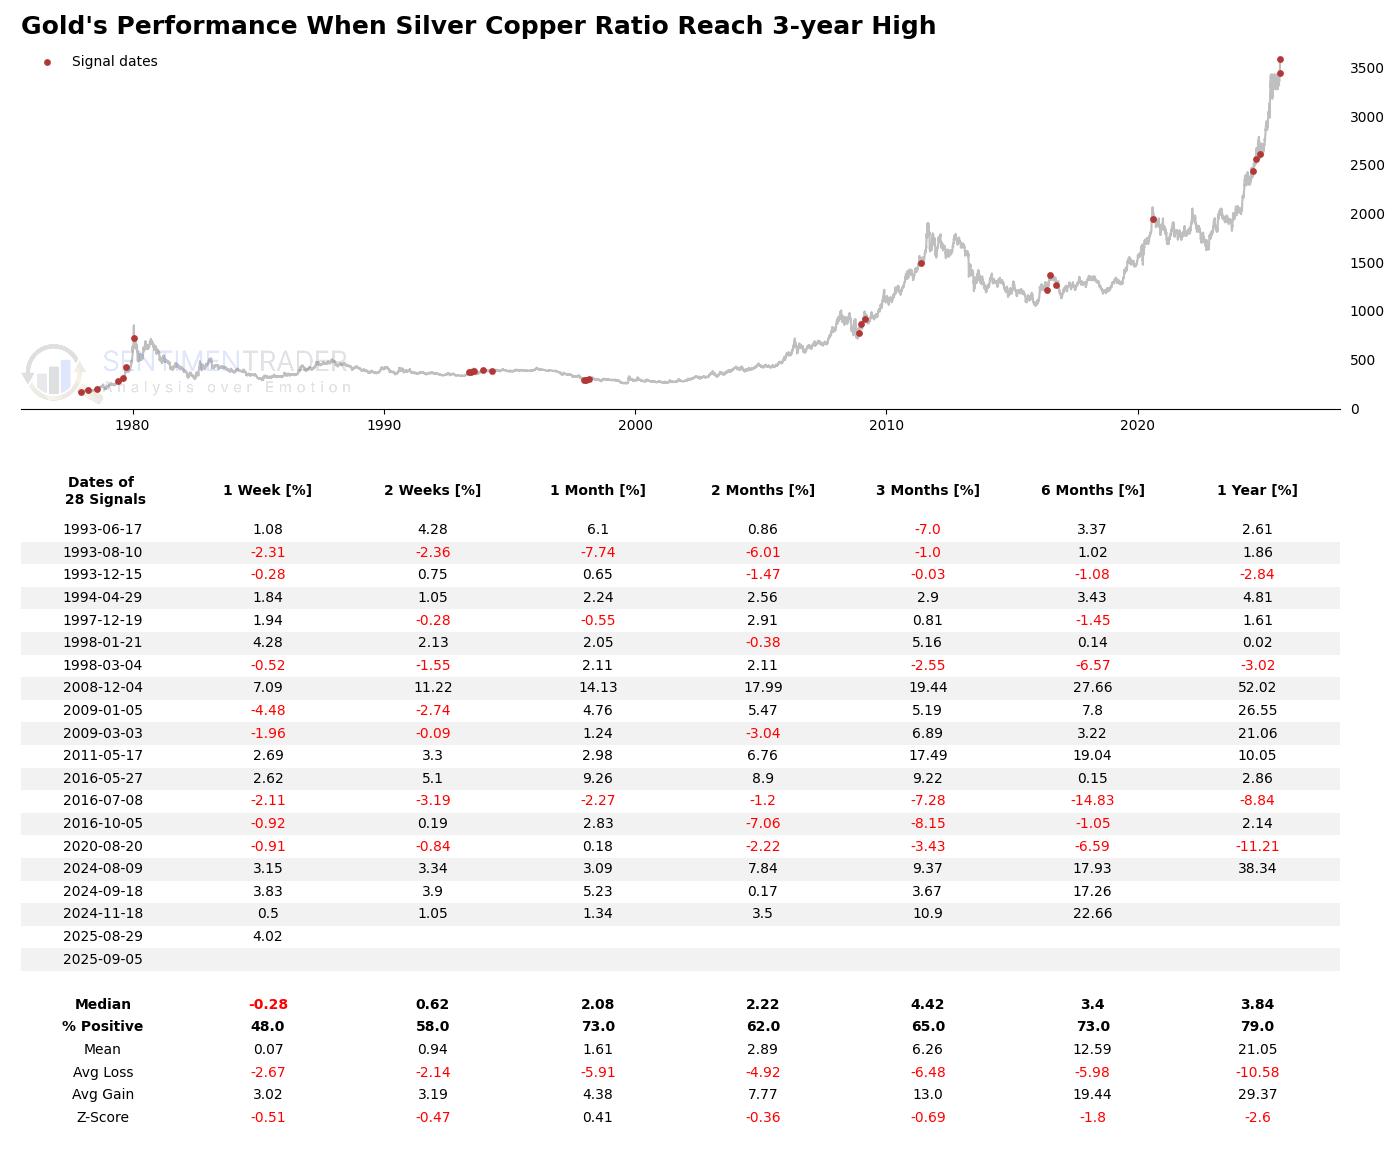
Unsurprisingly, gold's performance is exceptional. After the signal, gold posts strong positive returns across almost all time horizons, with an average one-year return as high as 21.05%, indicating its performance is far above its historical average. This confirms that the macro environment driving the ratio's surge-be it rate cut expectations or inflation concerns-is a perfect tailwind for gold. Backtest Details Click Here.
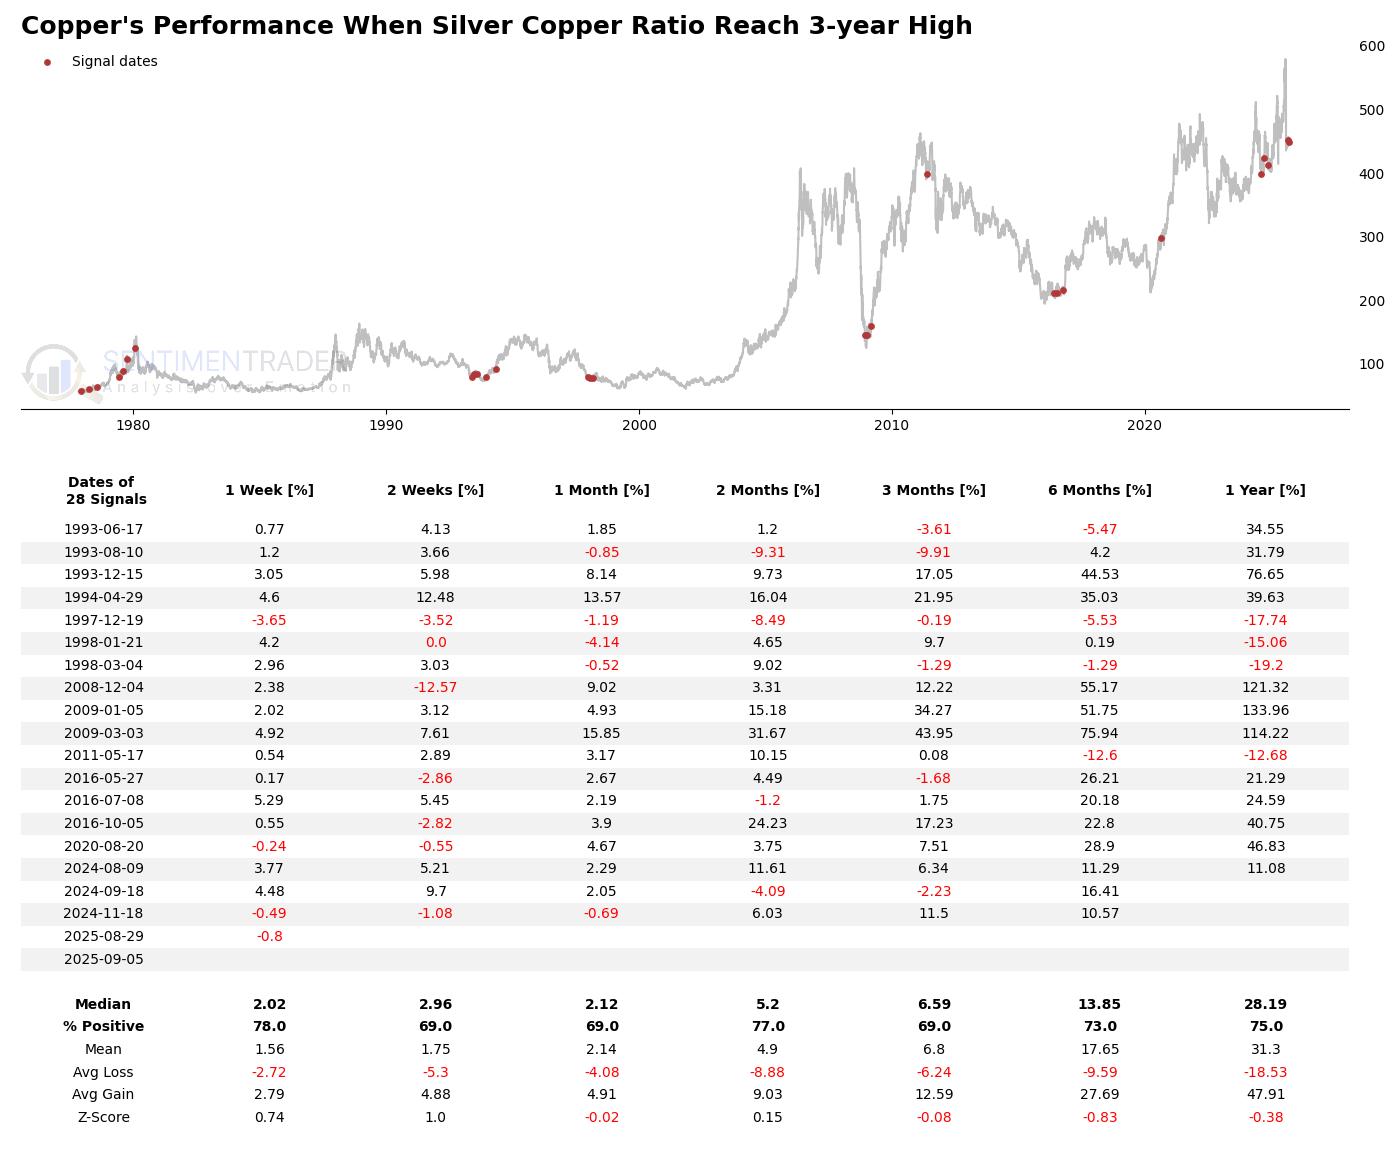
The performance of copper, the other side of the ratio, is equally interesting. It does not falter as the "physical economy collapse" narrative would suggest. One year later, copper's average return is also 24.6%. This shows that although copper's performance temporarily lags that of silver and gold, the monetary easing environment that lifts precious metals will eventually raise all boats, including industrial metals. Backtest Details Click Here.
The Rotation Playbook in an Easing Cycle
When the Silver/Copper ratio sounds the horn for a "reflation trade," the market's entire internal structure begins to dance. This is not a chaotic market where everything rises or falls together, but a structured market with a clear rotation playbook.
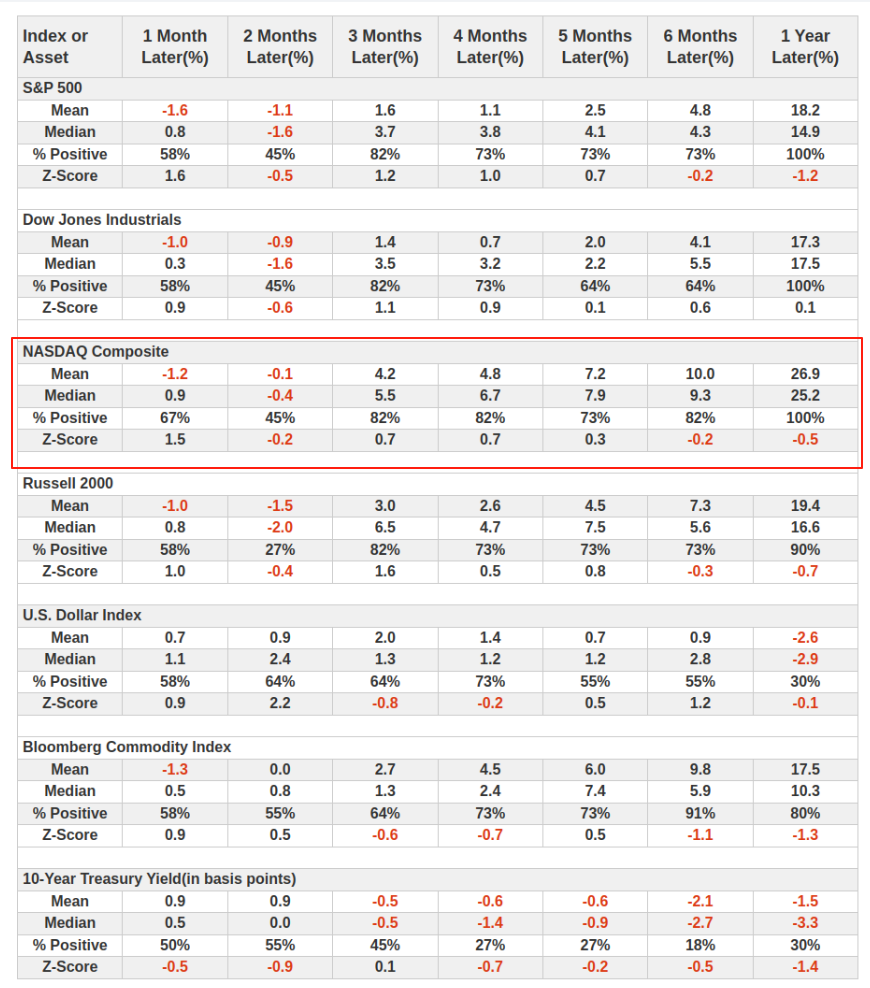
Judging by the performance of major indices, this is a clear "Risk-On" signal. After a brief period of hesitation following the signal, all major U.S. stock indices show a 100% probability of being higher one year later. The more interest-rate-sensitive Nasdaq index, in particular, becomes the clear market leader with an average one-year return of 26.9%. Meanwhile, the U.S. Dollar Index has only a 30% chance of being higher one year later, reflecting dollar weakness in a monetary easing environment.
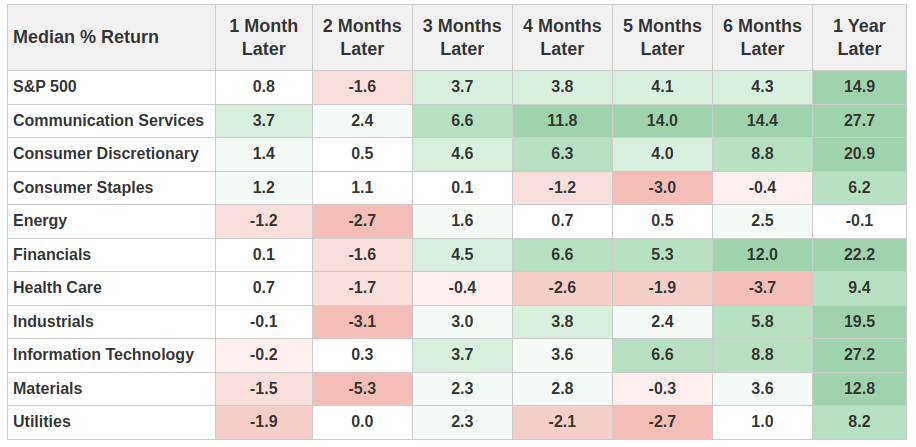
The performance of various industry sectors paints an even more precise picture of this rotation drama. The data reveals a clear dividing line:
Leaders: Sectors like Information Technology, Financials, and Consumer Discretionary. These are typical pro-cyclical or growth sectors that either directly benefit from expectations of an economic recovery or see their valuations boosted in a lower interest rate environment. Laggards: Defensive sectors like Utilities, Consumer Staples, and Health Care. In an environment of heightened risk appetite, these sectors are neglected by investors due to their low-beta nature.
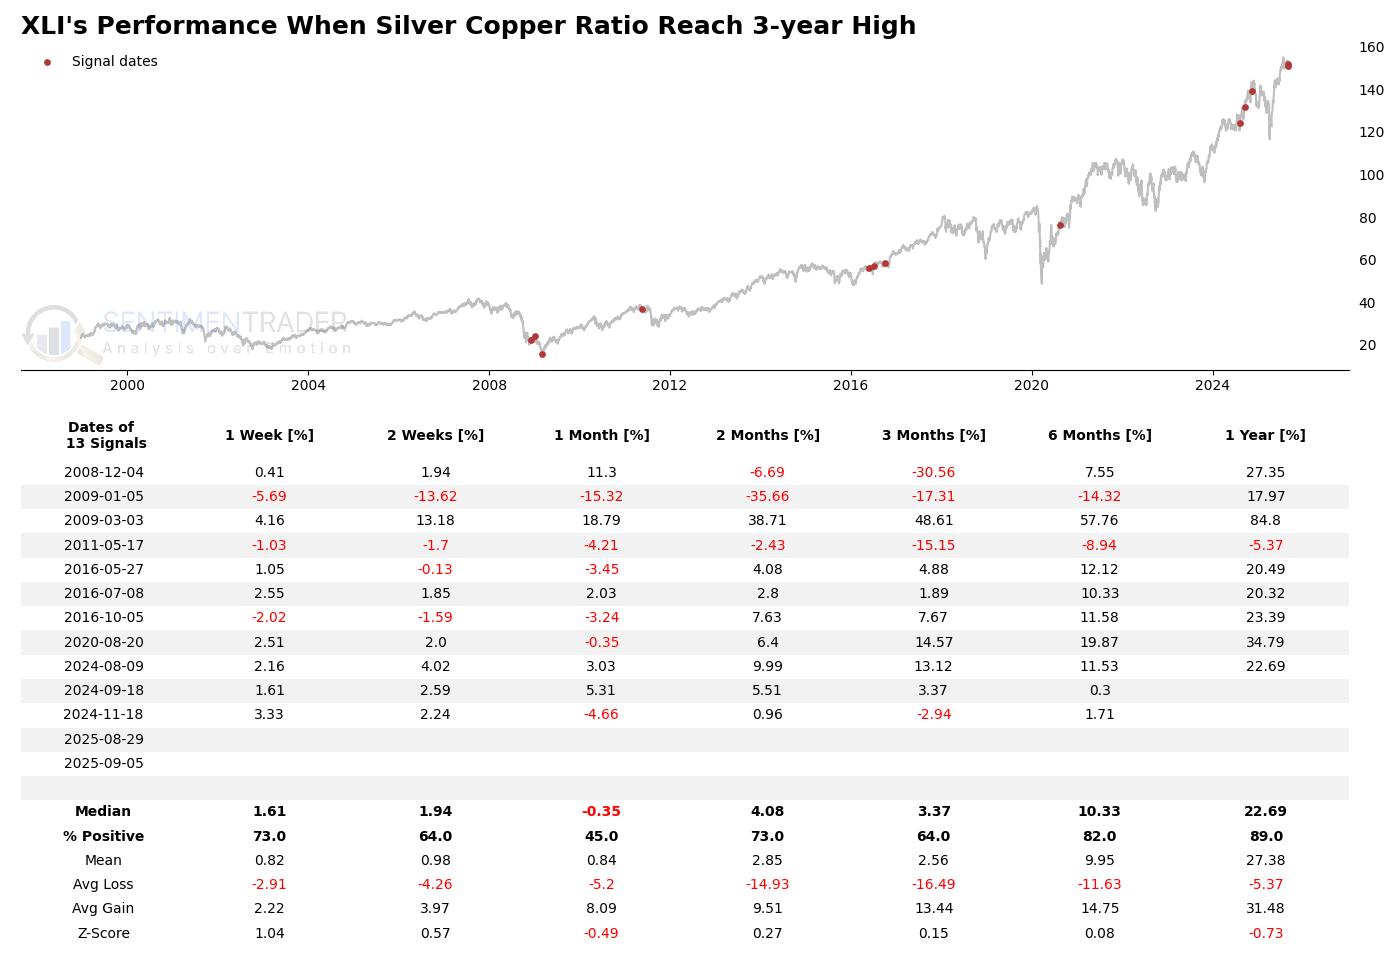
So, how does the industrial sector, the proxy for the real economy, perform? The data once again challenges the simple narrative. After the signal, the Industrials Sector ETF (XLI) has a 89% probability of being higher one year later, with an average return of 27.38%. This is completely at odds with the notion of "capital fleeing the physical economy." It reveals a deeper truth: the surge in the Silver/Copper ratio does not foretell the collapse of the industrial sector but rather signals the beginning of a "reflationary" environment led by monetary easing. In this environment, nearly all assets will rise, but those more sensitive to liquidity and with stronger financial attributes (like precious metals) will outperform.
It is worth noting that the performance of the Energy and Materials sectors is also relatively mediocre. This confirms our assessment once again: this is not a bull market driven by a strong recovery in physical demand, but a liquidity-driven bull market with tech and finance at its core. Investors are chasing future growth stories and an easy financial environment, not present-day physical output.
What the Research Tells Us…
The market is intricately complex, and attempting to use single, intuitive cross-market relationships to predict the future often leads one into a "narrative trap." Our analysis of the Copper/Gold and Silver/Copper ratios confirms this point precisely. In the specific macro context of a Federal Reserve that has already begun an easing cycle, these signals, interpreted by the market as "economic alarms," have had their traditional meanings completely upended. They are no longer omens of a market crash but have instead become precise probes for identifying the market's core driver: the "reflation" trade.
The data tells us that the main character on the current market stage is the liquidity injected by the central bank, and it dictates the pecking order of asset performance: Hybrid assets with "new economy" industrial + financial dual drivers (Silver) > Traditional industrial assets (Copper), and Growth/Financial Sectors > Defensive/Traditional Value Sectors. Of course, we must admit that the market's drivers are multifaceted, and various assets have their own independent logic for rising, but monetary policy is undoubtedly the loudest note that sets the market's primary theme at this juncture.
However, this roadmap painted by liquidity is not without its potential detours and storms. If stubborn inflation forces the Fed's easing policy to fall short of expectations, or if liquidity ultimately fails to mask the profound risks of an economic "hard landing," then the market's "script" could be rapidly rewritten. At the same time, when a trading thesis becomes the market consensus, the crowded nature and high valuations of the leading sectors themselves constitute a new uncertainty.
Therefore, the true potential of these metal ratios lies not in forecasting absolute market tops and bottoms, but in painting a clear roadmap for asset allocation and sector rotation for investors. In a world driven by liquidity, understanding the flow of capital is far more important than worrying about the short-term weakness of the real economy. But true wisdom lies in seeing the market's dominant script while simultaneously preparing for unexpected plot twists. The correct approach is to let the data guide us, to flexibly adjust our own roles, and to always maintain a reverence for the market's complexity.