
Two Strategies for Longer-Term Investors to Pay Attention To

Key points
- Making investment decisions based on objective rules can give investors a significant advantage
- Monitoring specific investment strategies can provide helpful guidance even if an investor does not rely 100% on them for trading signals
- Two strategies that longer-term investors should consider monitoring are our Aggregate Signal Model and High-Yield Cross Model
Two strategies to monitor
Click Tools | Strategies to access our Strategies Page. The Aggregate Signal Model and the High-Yield Golden Cross Model are two strategies that longer-term investors should consider. As we will see later, the odds of a major bear market are low when both models are favorable.
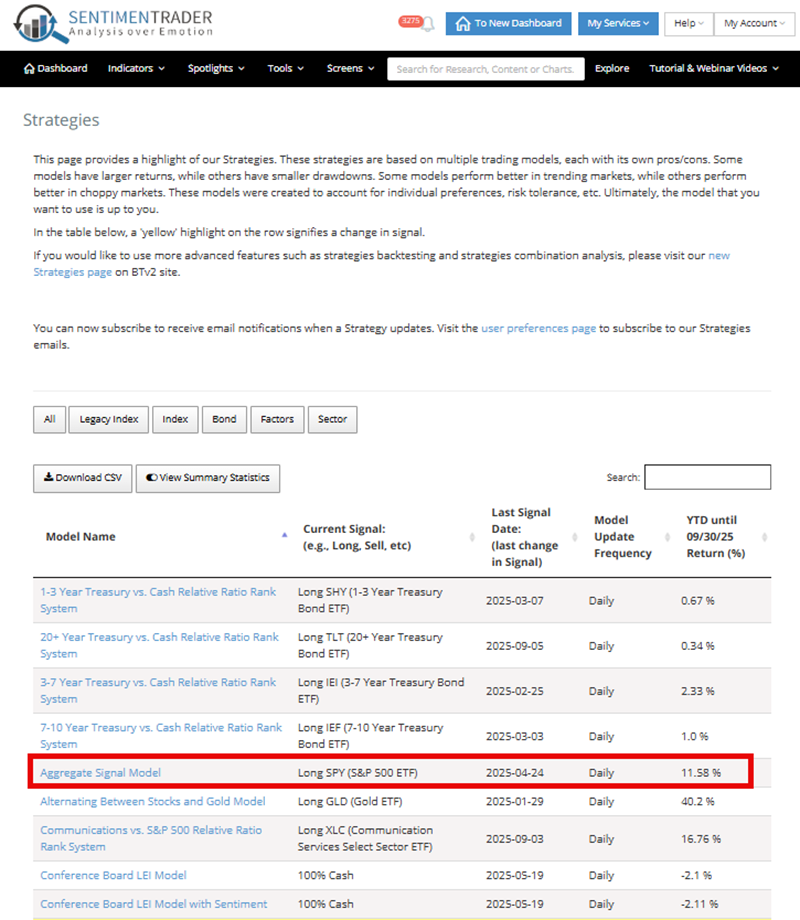
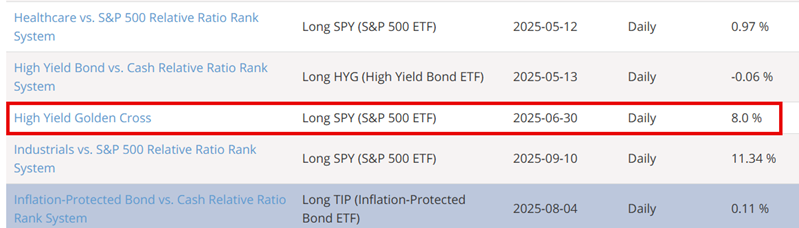
While nothing is ever guaranteed in the stock market, history suggests that when both of the highlighted models show "Long SPY (S&P 500 ETF)" as their position, the odds favor the bulls.
The Aggregate Signal Model shines a light on the Big Picture
Our Aggregate Signal Model is based on the number of our strategies that are favorable at any given point in time. The basic model uses a value of 0.45 as a cutoff between favorable and unfavorable for stocks. Be forewarned that relying solely on this one model to decide whether to be 100% invested in stocks or 100% in cash can be a challenging approach for many investors.
Historically, there are times when the model can flip from favorable to unfavorable repeatedly over a short period of time. While this is a viable approach, most investors are not built psychologically to go from a 100% fully invested position one day to 100% cash the next day and 100% back into stocks shortly thereafter. With that caveat in mind, let's take a closer look.
The chart below displays favorable (green arrows) and unfavorable (red arrows) signals for this model.
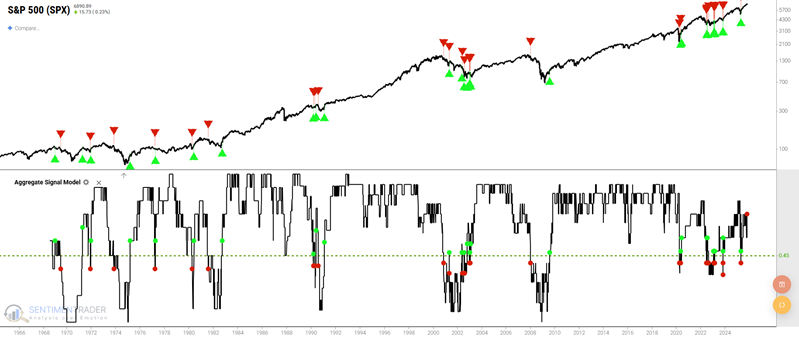
Note that the model can remain favorable or unfavorable for an extended period of time. However, as we see in 2020 and again in 2022 and 2023, reversing signals can occur rapidly at times.
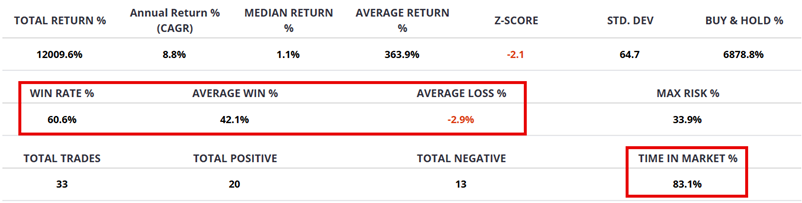
The table below summarizes the results. Key things to note:
- In the stock market 83% of the time
- 61% Win Rate (due to the whipsaw action in 2002 and 2022)
- An Average Win of 42% and an Average Loss of -3%
The chart below displays the hypothetical equity curves for the strategy (blue line) versus buying and holding the S&P 500 (grey line). Note the significant long-term outperformance (also note that these returns did not come without some significant volatility along the way).
The outperformance reflected above is a byproduct of missing some portion of several severe bear markets in the last 50 years - most noticeably in 1974, 2000-2002, and 2007-2009, as seen below as periods when the blue line went sideways (i.e., the Aggregate Signal Model was flat) while the grey line (buy-and-hold equity curve) continued to plunge significantly lower.
The chart below displays the hypothetical long-term equity curve generated by following all the signals. As you can see, it is not about "easy money." Notably, the results consistently trend from lower left to upper right (with smaller drawdowns than those experienced using a buy-and-hold approach).
The table below displays S&P 500 returns over various periods within the first twelve months after a buy signal.
Finally, the table below displays results for the S&P 500 sectors. Note that several sectors show one-year Win Rates of 95% or higher.
Should investors rely solely on buy and sell signals from the Aggregate Signal Model to inform their investment decisions? Not necessarily. Is there an apparent advantage to paying attention to this model and staying on the right side of the indicated trend? It would appear so.
The High-Yield A/D Line is an excellent tool for stock investors
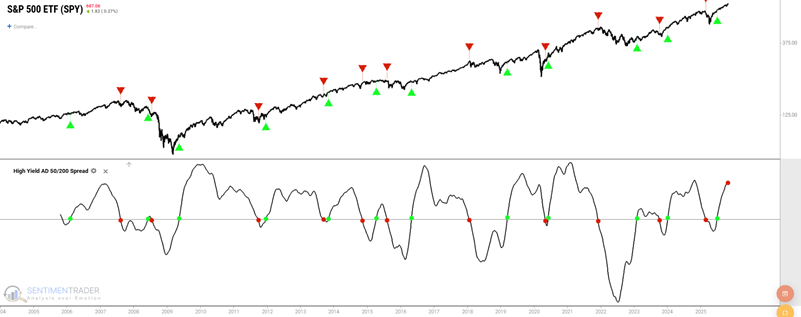
The High Yield Bond Cumulative A/D Line indicator tracks the cumulative advance/decline line for the high-yield bond market. This line will rise if more high-yield (junk) bonds are rising than falling. The strategy listed on our Strategies page compares this indicators' 50-day moving average to the 200-day moving average. It is considered bullish for stocks when the 50-day average is above the 200-day average and vice versa.
The bottom clip in the chart below displays the difference between the 50-day and 200-day averages with a horizontal line at zero. The top clip highlights bullish crosses above 0 with a green arrow, and bearish crosses below 0 with a red arrow.
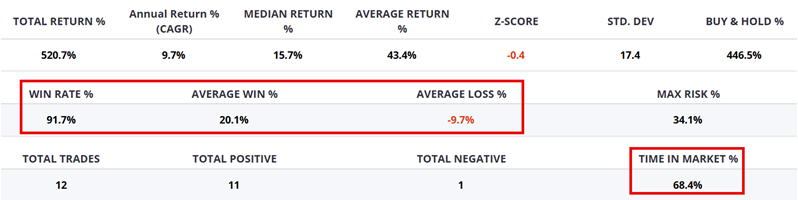
This strategy spends significantly less time in the market than the Aggregate Signal Model (68% versus 83%) but enjoys a much higher Win Rate (92% versus 61%).
The table below summarizes the results. Key things to note:
- In the stock market 68% of the time
- 92% Win Rate
- An Average Win of 20% and an Average Loss of roughly -10%
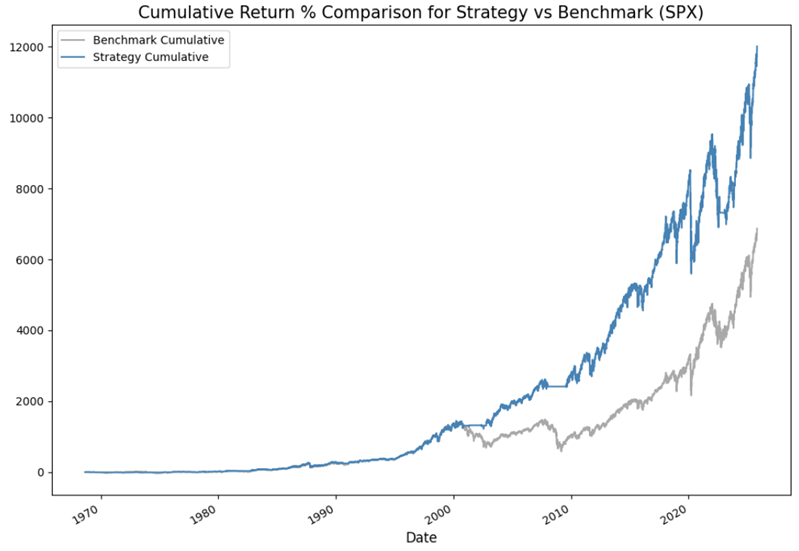
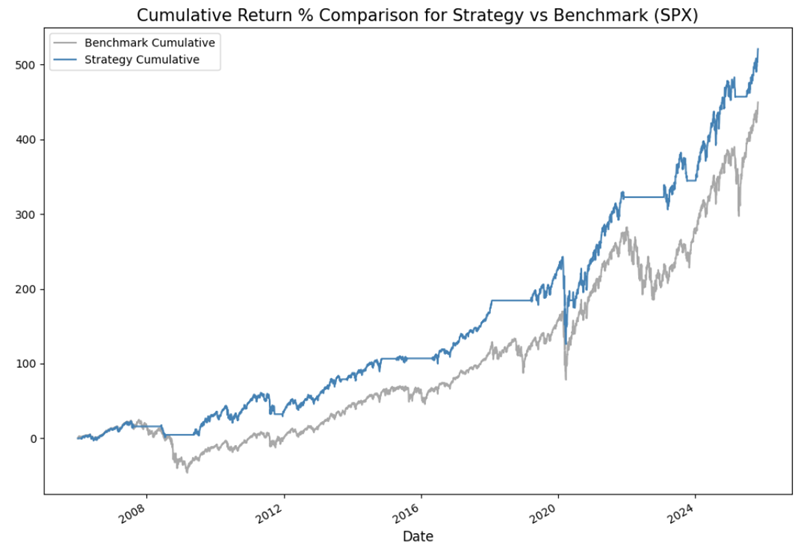
The chart below displays the hypothetical equity curves for the strategy (blue line) versus buying and holding the S&P 500 (grey line). Note the blue line's lack of significant drawdowns (except for the swift and severe COVID-related selloff in 2020).
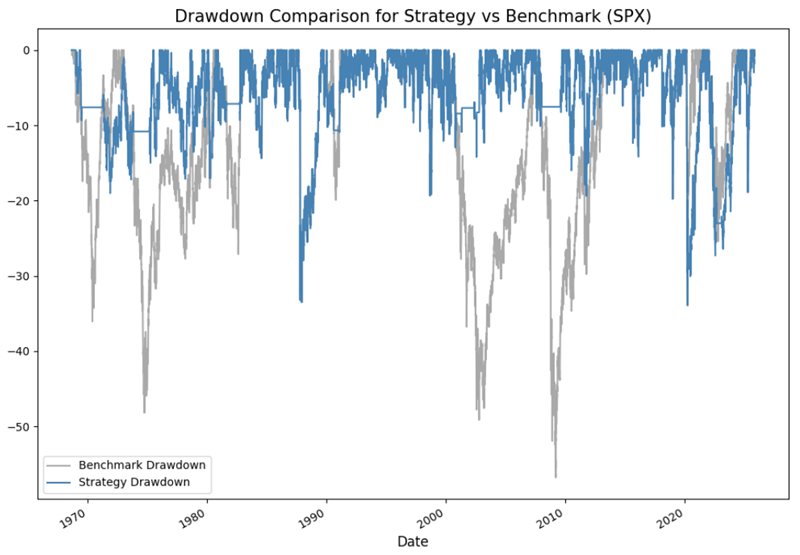
The chart below reflects the difference between drawdowns for the strategy versus buy-and-hold.
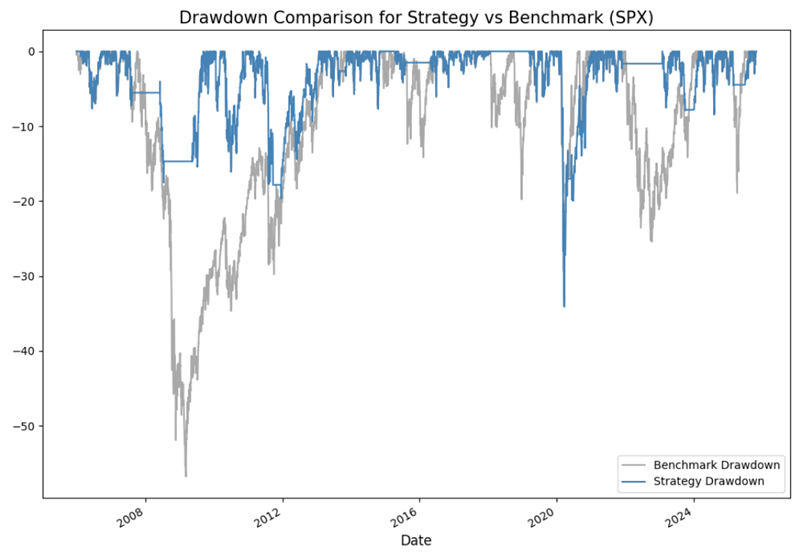
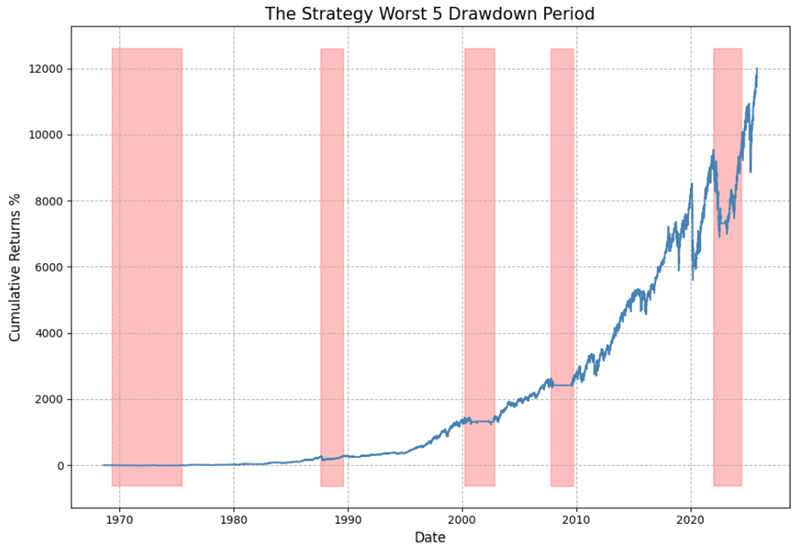
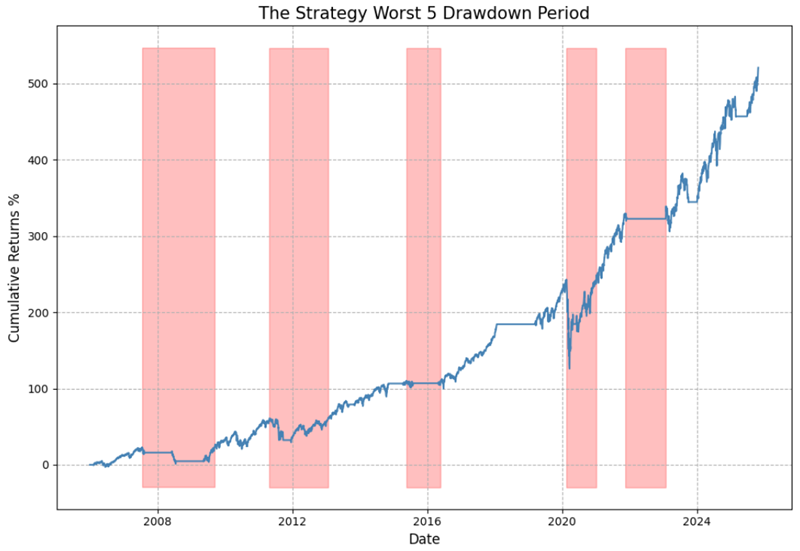
The chart below displays the hypothetical long-term equity curve generated by following all the signals. Once again, this strategy has limited downside risk, except for the 2020 COVID-19 selloff.
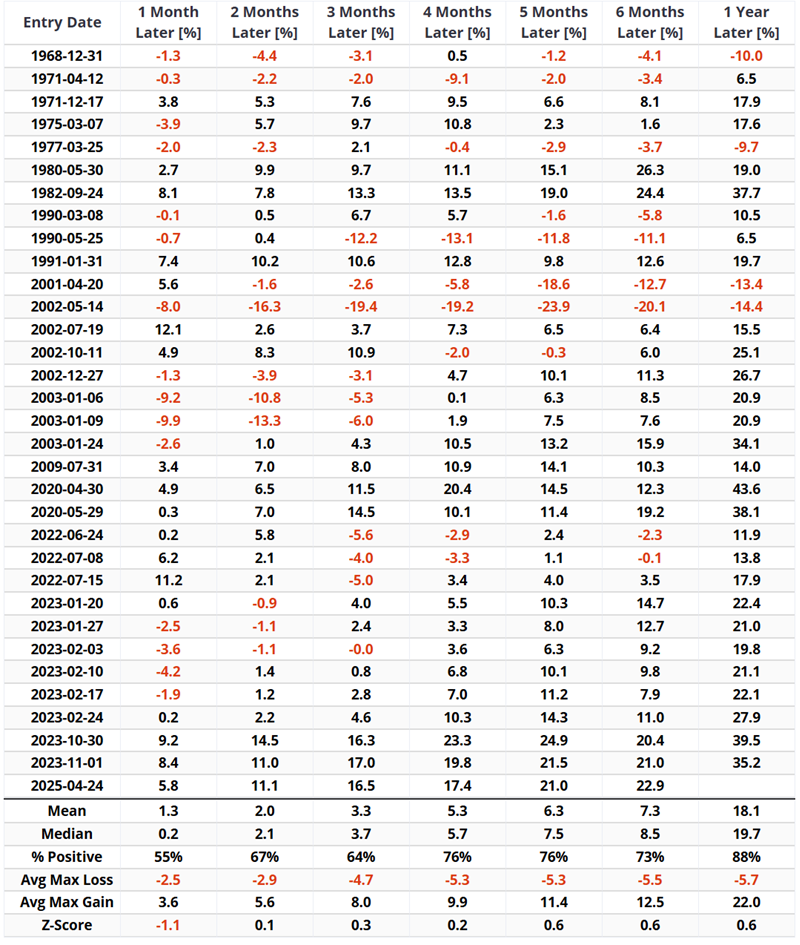
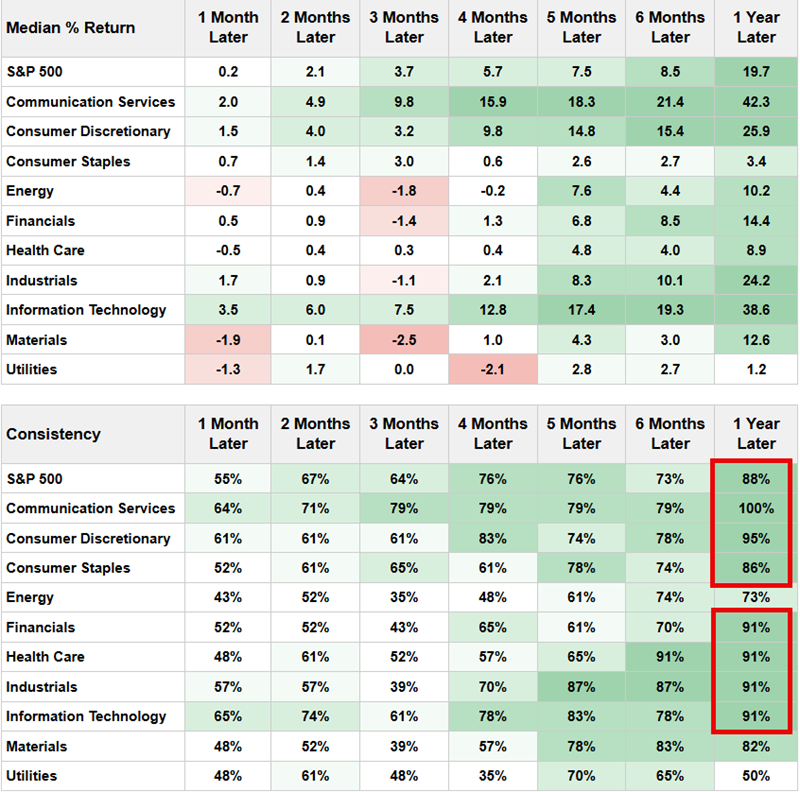
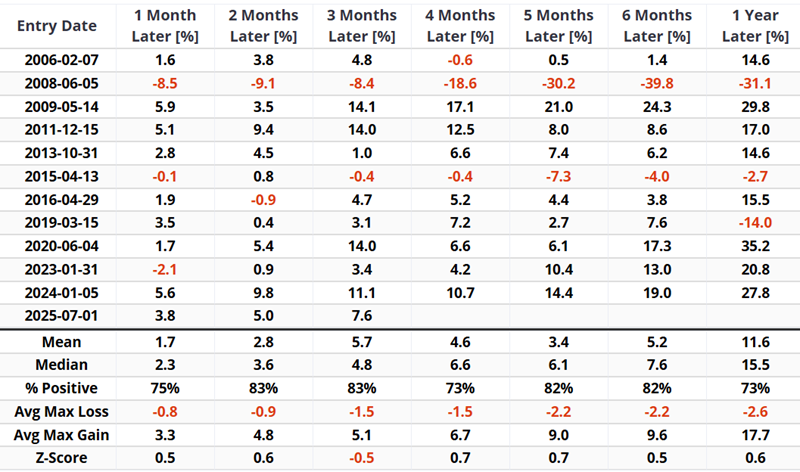
The table below displays S&P 500 returns over various periods within the first twelve months after a buy signal.
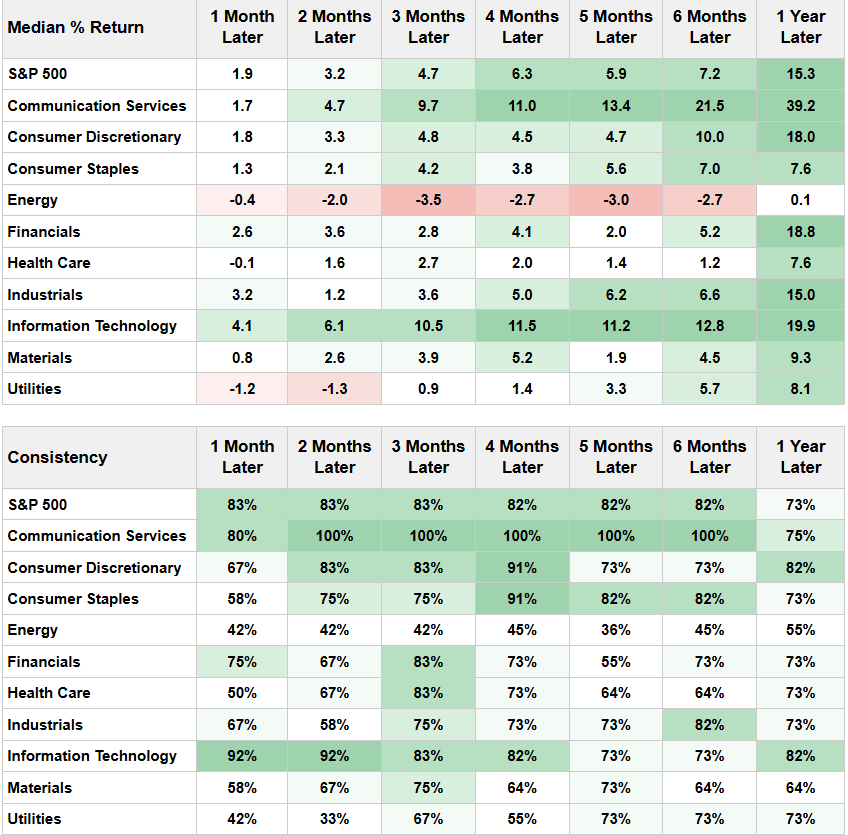
Finally, the table below displays results for the S&P 500 sectors. Technology and Consumer Discretionary are good choices for aggressive investors during the first year after a new buy signal.
Market performance when both models are favorable
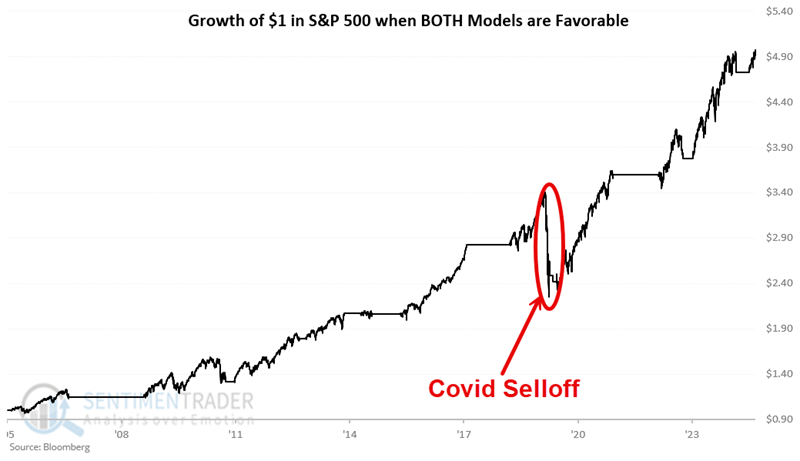
The chart below displays the hypothetical growth of $1 in the S&P 500 Index only during periods when both the Aggregate Signal Model and the High-Yield Golden Cross Model were favorable (i.e., "Long SPY (S&P 500 ETF)" as their position).
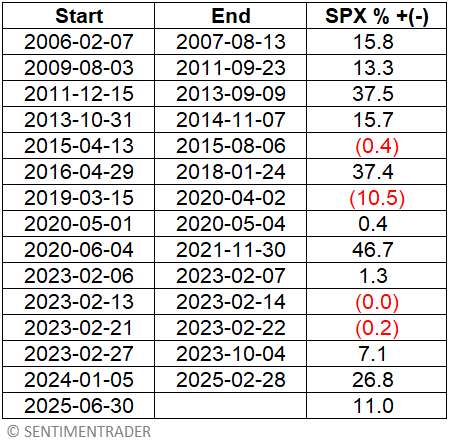
The table below displays the periods when both models were favorable and the S&P 500 performance during those specific periods.
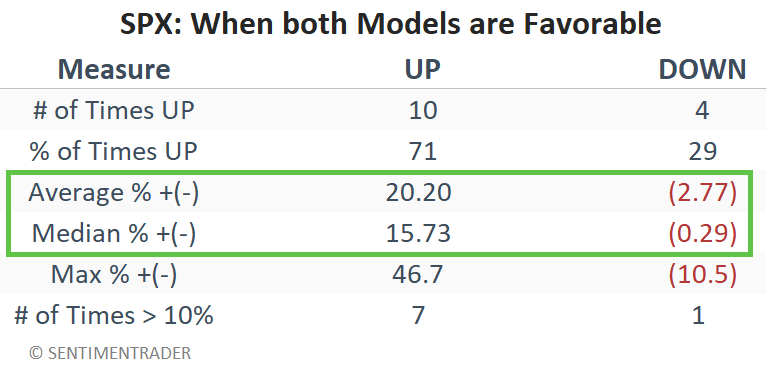
The table below summarizes the S&P 500 during the periods above.
What the research tells us…
Many longer-term investors aim to tinker with their portfolio/asset allocation as infrequently as reasonably possible. They hope to avoid being whipsawed in and out of the market based on the latest headlines, and to ride the primary trend as long as it reasonably appears to be bullish for stocks. Monitoring the two models highlighted above can help. As long as the Aggregate Signal Model and the High-Yield Gold Cross Model are favorable, history suggests that longer-term investors give the bullish case the benefit of the doubt.