Products
SentimenTrader Trading Tools
‍
Backtest Engine
My Trading Toolkit
Correlation Analysis
Seasonality
Market Prediction
Indicators & Data API
‍
Proprietary Indicators & Charts
Market Data API
Strategies & Scanner
‍
50+ Trading Strategies
Smart Stock Scanner
Smart Option Scanner
Research Reports
‍
Research Solutions
Reports Library
Free Resources
Simple Backtest Calculator
Simple Seasonality Calculator
The Kelly Criterion Calculator
Sentiment Geo Map
Public Research Reports
Education
Sentiment Indicators
Technical Indicators
Pricing
Company
About
In the News
Testimonials
Client Success Stories
Contact
Log inLoginSign up
< BACK TO ALL REPORTS

Two sectors to focus on in the next eight months

Jay Kaeppel
2022-12-01
Despite all angst and consternation regarding the economy, the market remains firmly within a favorable seasonal period. In the months ahead, two sectors stand out above the rest.

Key points:

  • The most favorable part of the 3-year election cycle began in October 2022
  • Based on historical tendencies, there are two primary sectors or factors that may benefit
  • Discretionary and small-cap stocks show returns far above other sectors and factors

A quick review of where we are in the election cycle

In this article, I highlighted that the most favorable portion - by far - of the four-year election cycle starts October 1st of the mid-term year and ends July 31st of the pre-election year. Based on the S&P 500 Index, there has not been a loss during this period since the1930's.

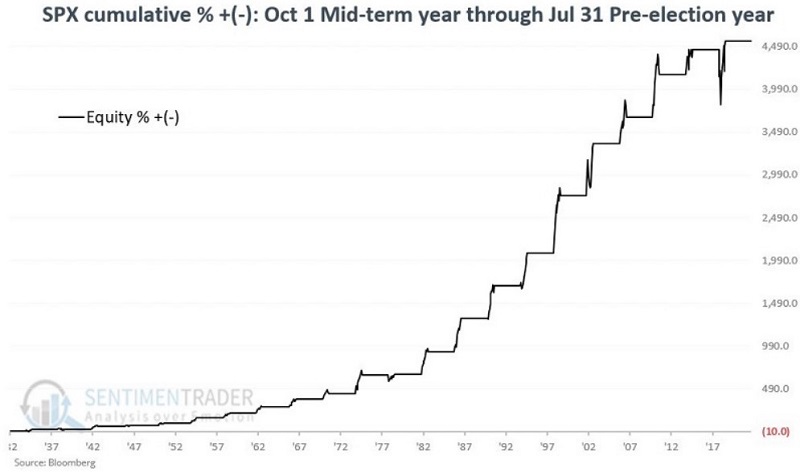
Over the first two months of this 9-month favorable period, the S&P 500 Index has far gained +13.8%. With December beginning, let's take a closer look at the sector and factor performance over the last seven months of this favorable period.

A look back at history

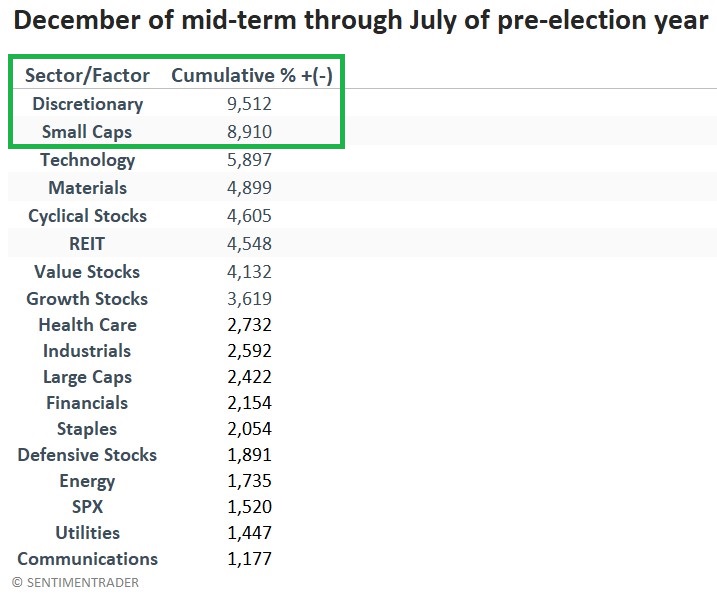
For this test, we use the Fama French data set from 1926 to 1991 and S&P 500 indexes and sector data after that. The table below displays the total return for each sector and factor if held only from December 1st of each mid-term year through the end of July each pre-election year, starting with the 1926-1927 period. By far, the two top long-term performers were Consumer Discretionary and Small caps. 

A closer look at Consumer Discretionary and Small caps

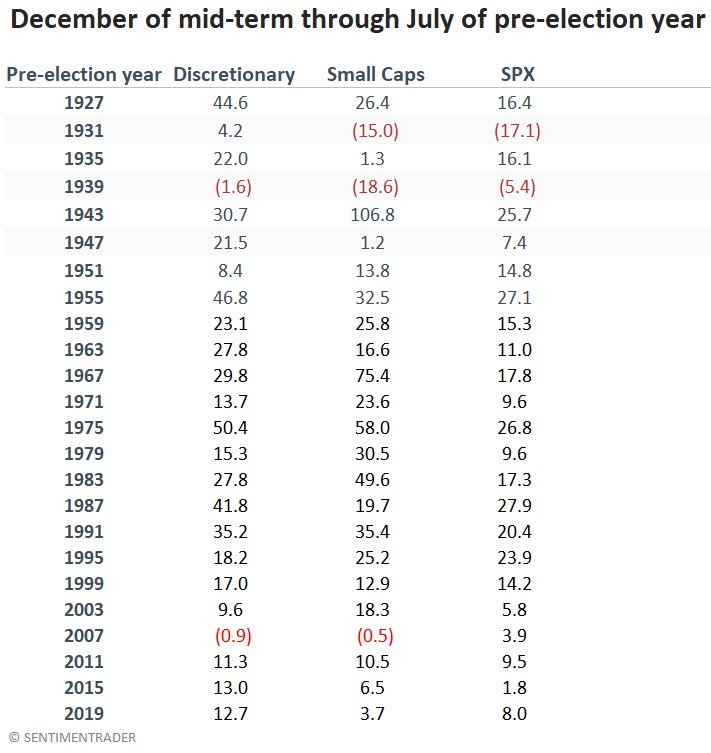
Let's take a closer look at their historical performance during December mid-term to July of the pre-election years starting in 1926. 

The table below shows the cumulative percentage performance for both sectors during the favorable period. The return for the S&P 500 during the same period is included for comparison.

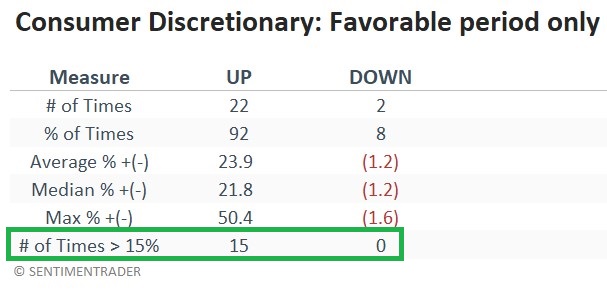
The chart below displays the growth of $1 invested in the Consumer Discretionary sector only during the favorable period.

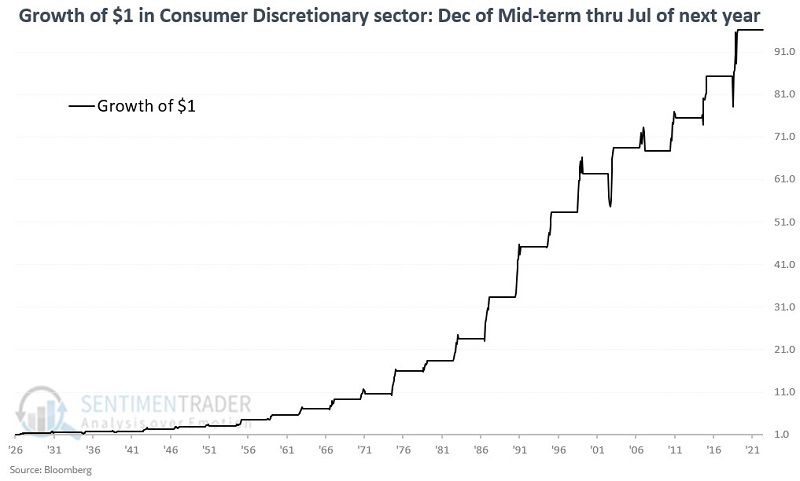
The frustrating thing about seasonal trends is that there is never any guarantee that they will continue to work. That said, the performance for consumer discretionary during this particularly favorable period is hard to quibble with. The largest full-period decline was a loss of -1.6%; on 15 separate occasions, the full-period gain exceeded +15%.

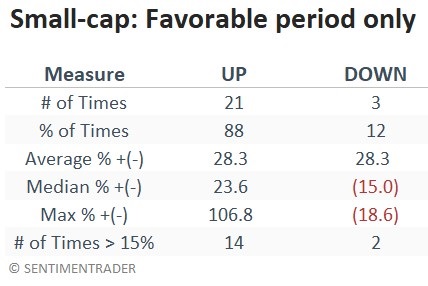
Now let's turn to the small-cap sector (see also here and here). The chart below shows the growth of $1 invested in the Small-cap sector only during the favorable period.

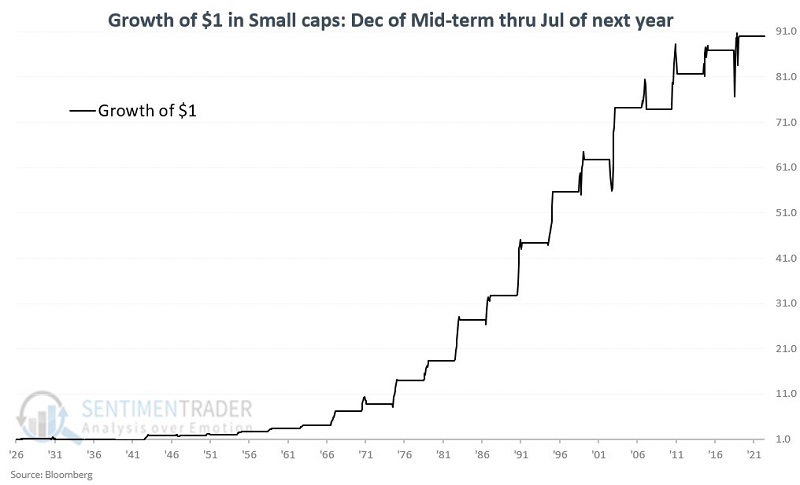
During the favorable period, Small-caps suffered two losses in excess of -15% in the 1930s. Since then, the only down period was a loss of -0.5% in 2006-2007. On 14 separate occasions, Small-caps showed a gain above +15%.

What the research tells us…

This portion of the four-year election cycle has been rock solid in performance for over 90 years. In addition, consumer discretionary and small-caps have been the hands-down top performers during this period. No matter how favorable the historical results for any trend, an investor is not relieved of their responsibility to make the critical decisions regarding a) how much capital to reasonably commit and b) when to cut a loss if things go wrong.

PRODUCTS
SentimenTrader
Trading Tools
Indicators & Data API
‍
Strategies & Scanner
‍
Research Reports
FREE
RESOUrCES
Simple Backtest
Calculator
Simple Seasonality
Calculator
The Kelly Criterion
Calculator
Sentiment Geo Map
‍
Public Research Reports
‍
Education
Sentiment Indicators
‍
Technical Indicators
‍
Pricing
Bundle pricing
‍
FAQ
‍
Announcements
‍
COMPANY
‍
About
‍
In the News
‍
Testimonials
‍
Client Success Stories
CONTACT
‍
General Inquiries
‍
Media Inquiries
‍
Financial Professionals Inquiries
‍
© 2026 Sundial Capital Research Inc. All rights reserved.
Setsail Marketing
TermsPrivacyAffiliate Program
Risk Disclosure: The information and tools provided are for research and analytical purposes only and are not intended as investment advice. Market analysis involves uncertainty, and outcomes may differ from expectations. Users should conduct their own due diligence and consider their individual circumstances before making any financial decisions. Past performance is not necessarily indicative of future results.

Hypothetical Performance Disclosure: Hypothetical performance results have many inherent limitations, some of which are described below. No representation is being made that any account will or is likely to achieve profits or losses similar to those shown; in fact, there are frequently sharp differences between hypothetical performance results and the actual results subsequently achieved by any particular trading program. One of the limitations of hypothetical performance results is that they are generally prepared with the benefit of hindsight. In addition, hypothetical trading does not involve financial risk, and no hypothetical trading record can completely account for the impact of financial risk of actual trading. for example, the ability to withstand losses or to adhere to a particular trading program in spite of trading losses are material points which can also adversely affect actual trading results. There are numerous other factors related to the markets in general or to the implementation of any specific trading program which cannot be fully accounted for in the preparation of hypothetical performance results and all which can adversely affect trading results.

Testimonial Disclosure: Testimonials appearing on this website may not be representative of other clients or customers and is not a guarantee of future performance or success.