
Two sectors for spring

Key Points
- The energy and utilities sectors have a history of performing well during the early spring
- Seasonality is not a roadmap, so traders should look for price trend confirmation
- While the price action has been mixed, both sectors have recently been showing strength "under the surface"
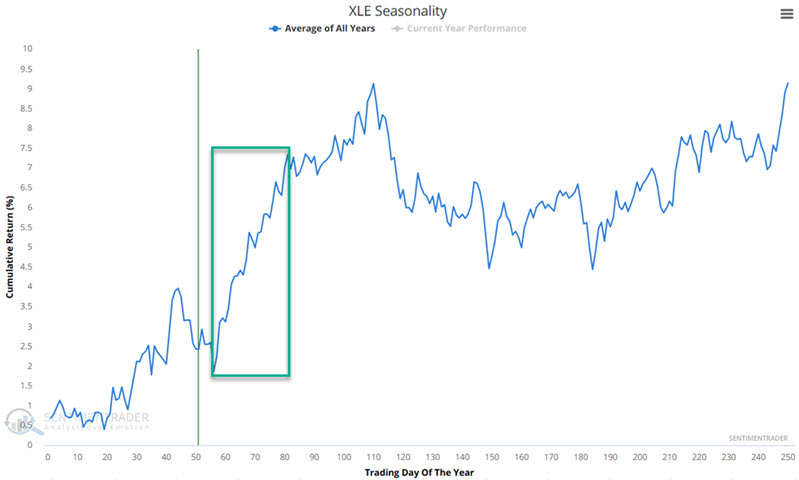
Energy tends to shine in spring
The chart below displays the annual seasonal trend for the Energy Select Sector SPDR Fund ETF (XLE). The period highlighted in the green box extends from Trading Day of the Year (TDY) #56 through TDY #83. For 2025, this period extends from the close on 2025-03-25 through 2025-05-02.
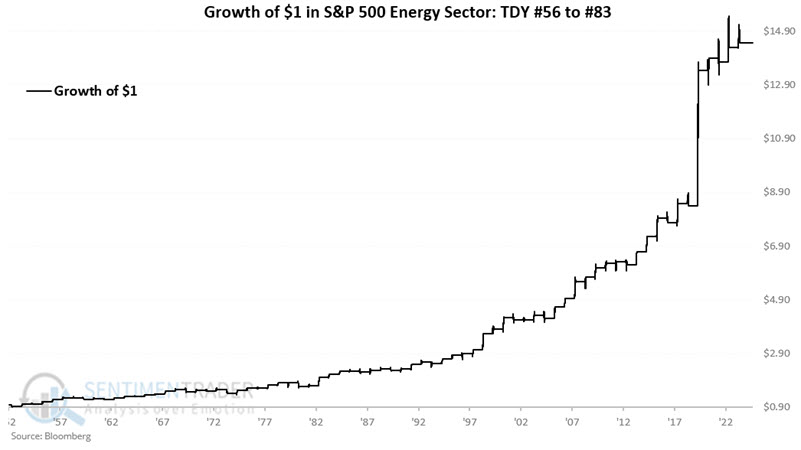
The chart below displays the hypothetical growth of $1 invested in the S&P 500 Energy Sector Index (which XLE tracks) from TDY #56 through TDY #83 every year since 1953.
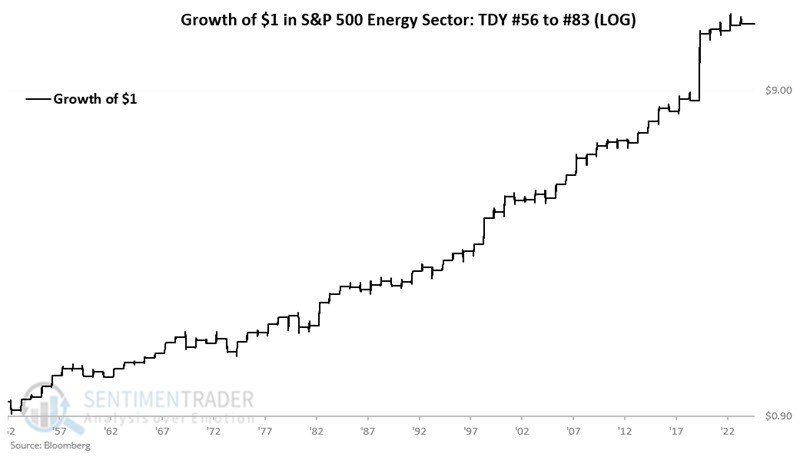
The chart below displays the same information on a logarithmic scale.
The table below summarizes the S&P 500 Energy Sector performance during the TDY #56 to #83 period.
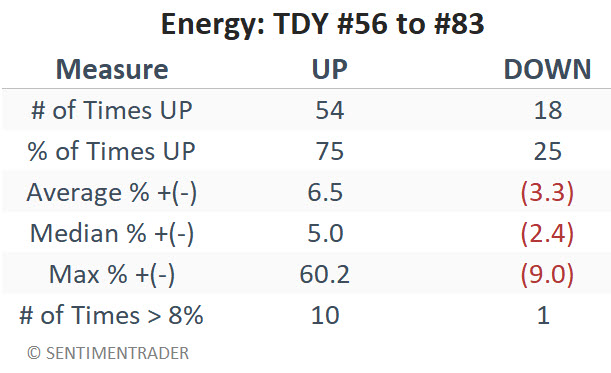
Note that a 75% win rate equates to three out of every four years, which shows a gain during this period. Of particular interest is that moves of 8% or more skewed to the positive by a factor of 10-to-1.
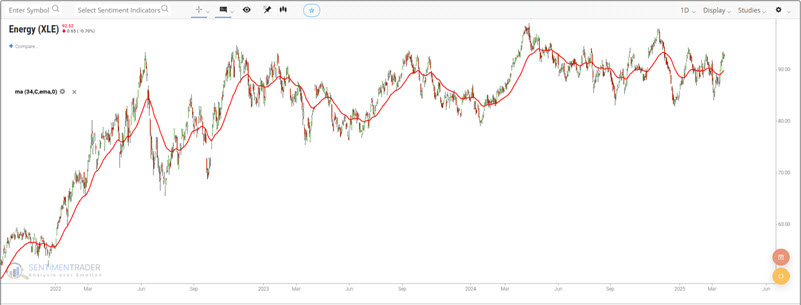
Regarding price action, during this favorable period, traders should look for XLE to hold above its 34-day exponential moving average as confirmation of an uptrend.
Utilities could hold up well
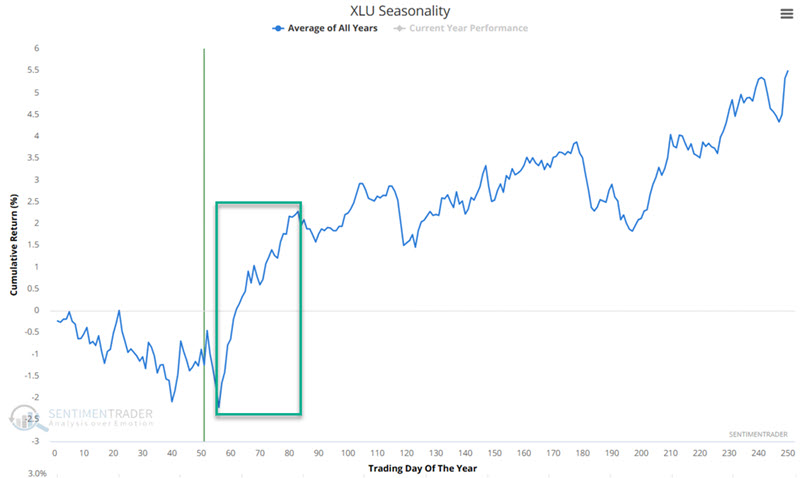
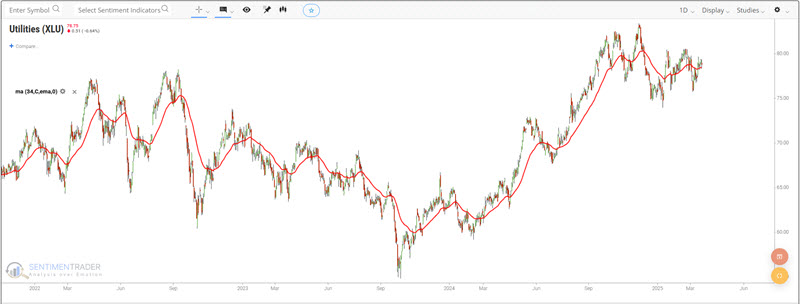
The chart below displays the annual seasonal trend for the Utilities Select Sector SPDR Fund ETF (XLU). The period highlighted in the green box extends from Trading Day of the Year (TDY) #56 through TDY #83. For 2025, this period extends from the close on 2025-03-25 through 2025-05-02.
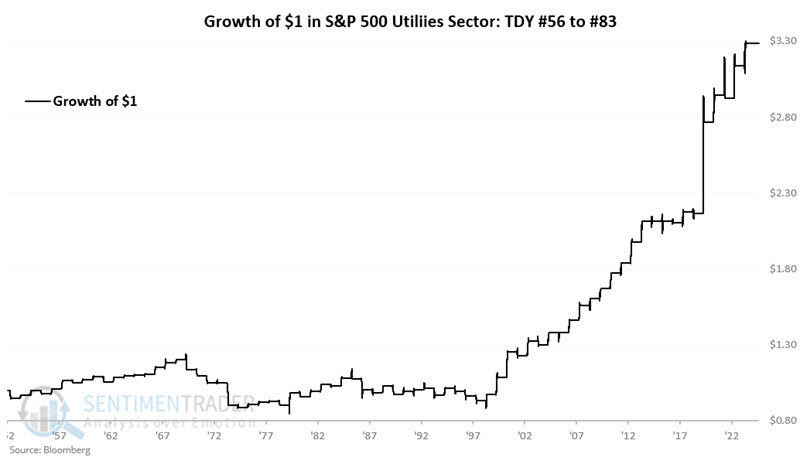
 The chart below displays the hypothetical growth of $1 invested in the S&P 500 Utilities Sector Index (which XLU tracks) from TDY #56 through TDY #83 every year since 1953.
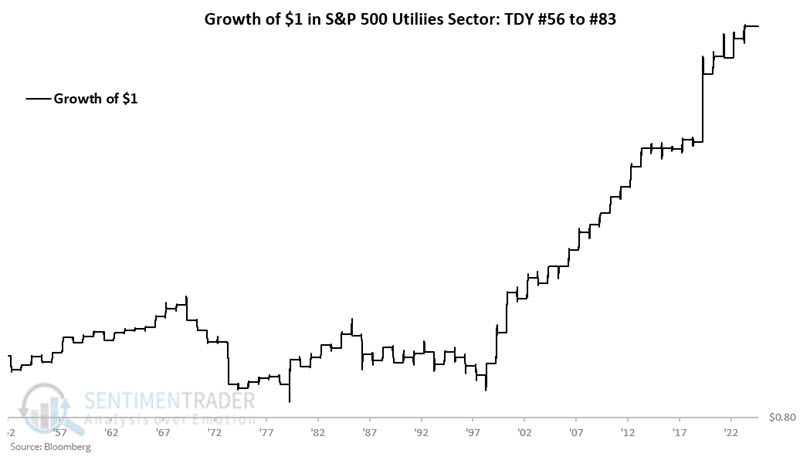
The chart below displays the same information on a logarithmic scale.
Note that results were not favorable before 1998. Since then, this period has shown a much higher percentage of gains over the last 26 years. The table below summarizes performance since 1953.
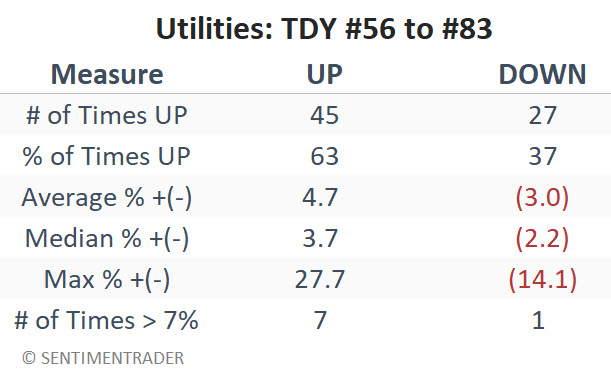
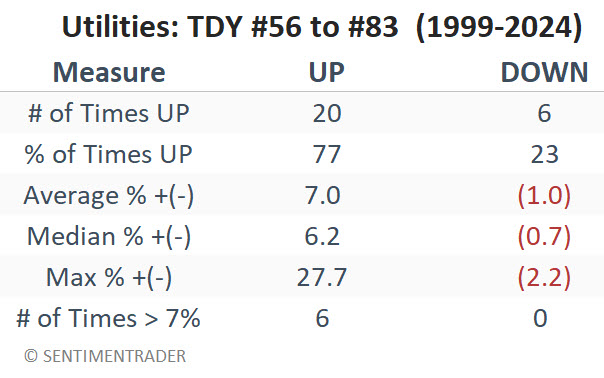
The table below summarizes performance since 1999. Note that the largest loss during this period in the last 26 years is -2.2%.
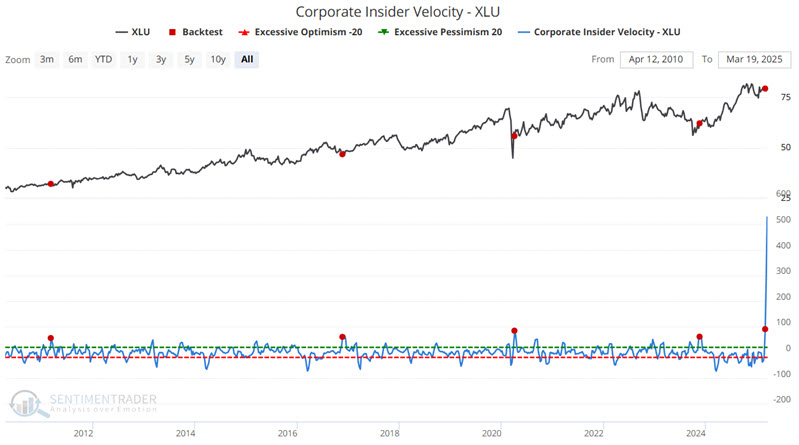
Another factor worth mentioning regarding the utilities sector is corporate insider activity. Our Corporate Insider Velocity - XLU indicator recently experienced something unusual. Insider buying and selling both declined to a relatively low level. Then, recently, buying picked up. Our Velocity indicator measures rate-of-change and picks up on this subtle yet potentially significant shift in the insider psyche.
The chart below highlights each time the Corporate Insider Velocity - XLU indicator crossed above 55.
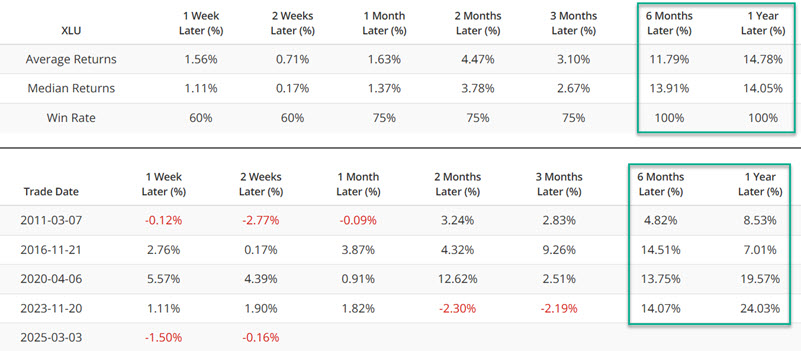
The table below summarizes subsequent XLU performance.
Regarding price action, during this favorable period, traders should look for XLU to hold above its 34-day exponential moving average as confirmation of an uptrend.
Some quiet strength "under the surface"
In the bar charts above, we saw that the price action for both sectors was decent but not great. However, if we look at the action of the constituent stocks for both XLE and XLU, we find some well-above-average strength. Looking at our S&P 500 Sector Trend Scores Summary and sorting by "Trend Score >=8," we find that Utilities and Energy are ranked #1 and #3 among the eleven S&P 500 sectors.
This does not guarantee that these sectors will rally. It tells us that, overall, the stocks in those sectors have been outperforming most stocks in other sectors. As "strength tends to beget strength" in the stock market, this could be a very positive sign for energy and utilities as we move into their favorable seasonal periods.
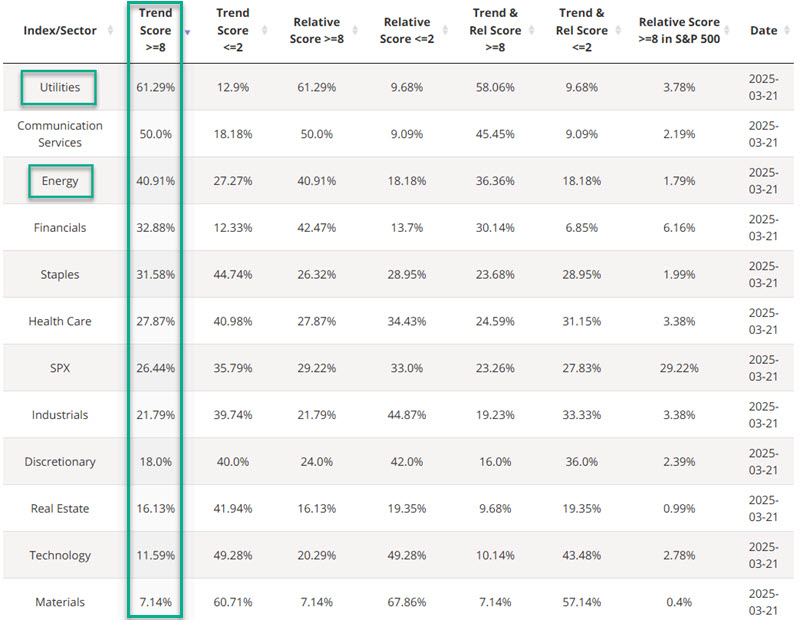
Some will note that a preponderance of "defensive" sectors (utilities, energy, staples, and health care) are near the top of the list and assert that this is bad for the market. And ultimately, that is a possibility. However, this seems a good time to invoke:
Jay's Trading Maxim #13: There's always a bull market somewhere. Our job as investors is to find it.
If utilities and energy assume a leadership role and perform relatively well in the months ahead, there is no reason not to be on board.
What the research tells us…
Seasonality tells us "when to look where," i.e., it helps us zero in on potential opportunities. However, it is not a roadmap, and no trader should ever assume that a given seasonal trend will work the next time. With that caveat in mind, over many decades, both the energy and utility sectors have demonstrated a strong tendency to perform well during the period just ahead. Traders willing to consider these opportunities must decide whether or not to allocate capital, and if so, how much, and most importantly, how to manage risk.