
Two Sectors for Short-Term Traders to Consider

Key points:
- The stock market is showing terrific strength, so a pullback remains a distinct possibility
- That said, several sectors are entering periods of historically significant and persistent strength, so traders should be looking for opportunities to play the long side
- Consumer Discretionary and Healthcare are two sectors to consider
Sector #1: Consumer Discretionary
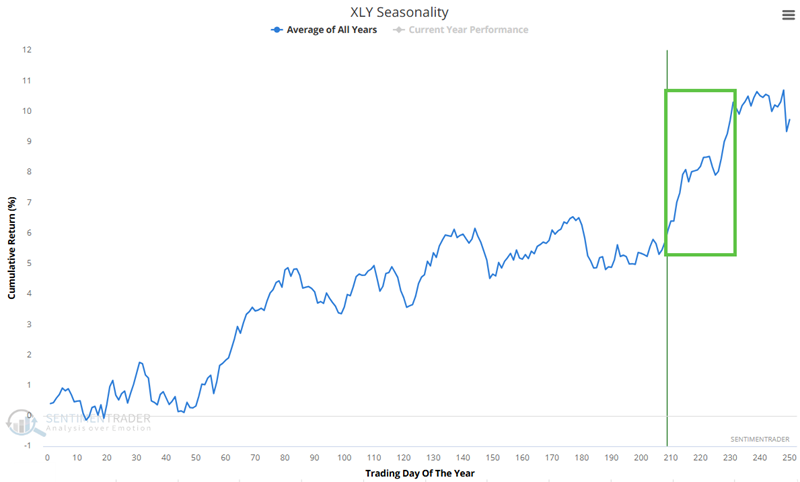
The Annual Seasonal Trend chart for the Consumer Discretionary Select Sector ETF (XLY) is entering a favorable seasonal period of the year while already in an established uptrend. This period extends from Trading Day of the Year (TDY) #209 through TDY #231. For 2025, this period extends from October 31st through December 3rd.
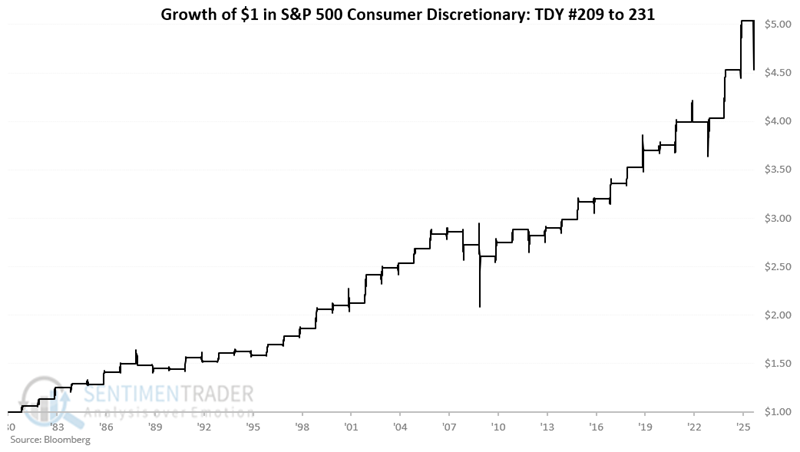
The chart below displays the hypothetical growth of $1 invested in the S&P 500 Consumer Discretionary Sector Index (which XLY is designed to track) only during this period, every year starting in 1980.
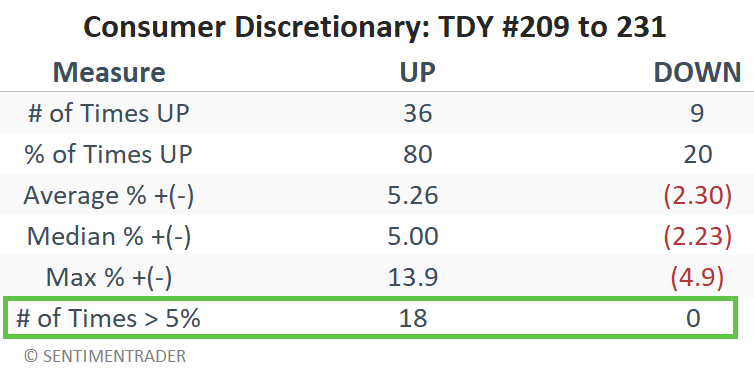
The table below summarizes the results. It is important to remember that there is nothing "automatic" about a seasonal trend. An 80% Win Rate is outstanding, but it also reminds us that the security in question has lost ground during the period in question, once every five years. On the brighter side, since 1980, the worst loss for Consumer Discretionary during this period was a manageable -4.9%. Likewise, moves of 5% or more skew to the positive side, 18 to 0'
The price chart below displays ticker XLY versus its 70-day exponential moving average.
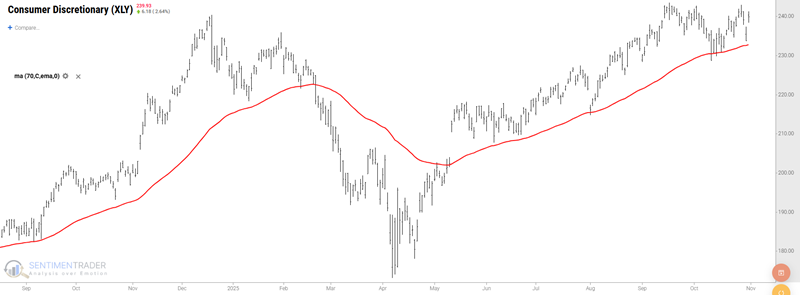
As with most charts, an individual can see whatever they want to see in the one above. Some will see a security in an uptrend, others will see a potential double top, and others still might note (correctly) that XLY has underperformed the S&P 500, so technically could be deemed a "laggard."
All of that aside, the key point here is that seasonality and price action are currently in favorable alignment. While there are never any guarantees in the market, this confluence of seasonality and price action tends to offer decent trading opportunities.
Sector #2: Healthcare
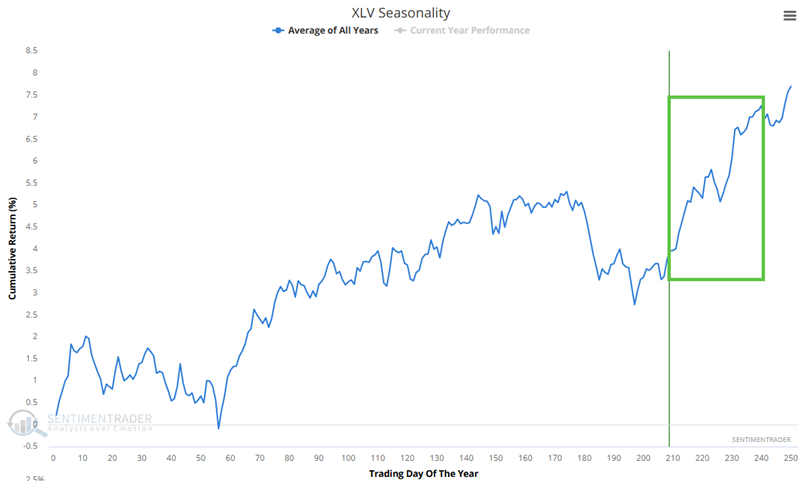
The Annual Seasonal Trend chart for the Health Care Select Sector SPDR Fund ETF (XLV) is entering a favorable seasonal period of the year while already in an established uptrend. This period extends from Trading Day of the Year (TDY) #209 through TDY #240. For 2025, this period extends from October 31st through December 16th.
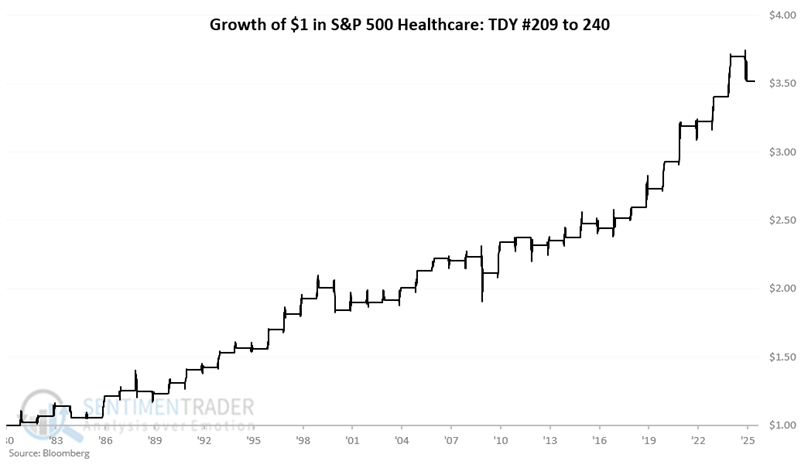
The chart below displays the hypothetical growth of $1 invested in the S&P 500 Healthcare Sector Index (which XLV is designed to track) only during this period every year starting in 1980.
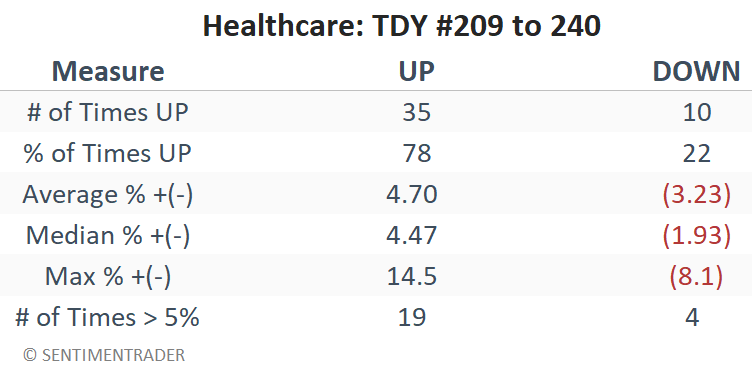
The table below summarizes the performance results for the Healthcare sector during this period since 1980.
The price chart below displays ticker XLV versus its 70-day exponential moving average.
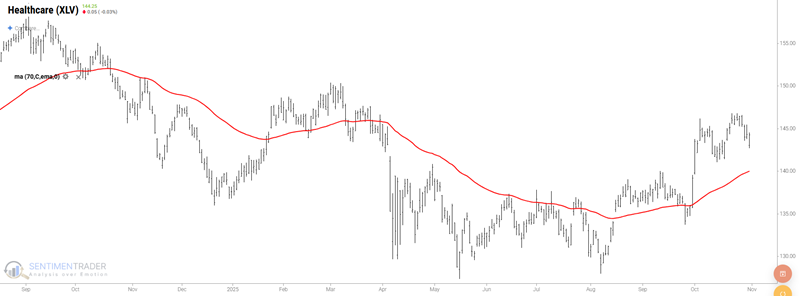
As you can see in the chart above, while the overall stock market demonstrated great strength over the past several years, the Healthcare Sector experienced something of a bear market. The good news is twofold. First, price action has now turned favorable, so when combined with a favorable seasonal period, it offers a potential opportunity for shorter-term traders.
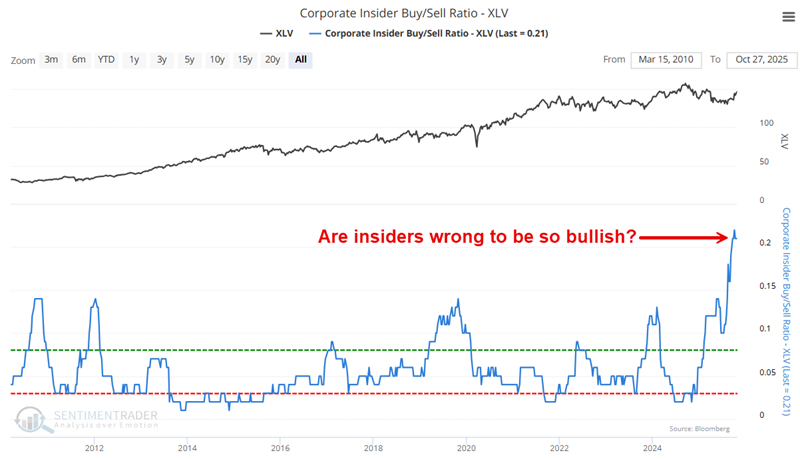
The second piece of good news for the Healthcare sector is the extremely bullish action of insiders in recent months. Consider the Insider Buy/Sell Ratio chart below. Either health care insiders see something favorable developing in their industry, or they have entirely lost their minds. History favors the former.
What the research tells us…
As always, seasonality is ultimately a look back at what has happened in the past, not a roadmap of what will happen in the future. As a result, traders must remember that even the most historically persistent seasonal trend can fail the next time around. Therefore, requiring price action to agree with seasonality to confirm a trend can be very helpful in identifying the best opportunities. Likewise, regardless of the setup that triggers any trade, a trader is never relieved of their responsibility to a) intelligently allocate capital (i.e., never "bet the ranch"), and b) ruthlessly manage risk.