
Two new breadths of fresh air for the stock market

Key points
- The NYSE McClellan Oscillator just crossed a significant threshold
- SPY Breadth recently bounced off of an oversold level while the index was in an uptrend
- Both of the above events lend weight to the favorable side of the ledger
McClellan Oscillator hits a rarified level
The McClellan Oscillator is based on work pioneered by Sherman and Marian McClellan. It is currently carried on by their son Tom (search the web for "McClellan Oscillator" for more background). It is essentially a look at the momentum of the underlying breadth of the market. When it is above zero, momentum is positive; below zero, it is negative.
The oscillator just pierced a rare level last week as it crossed above 91%. The chart below highlights all dates since 1973 when the McClellan Oscillator crossed above 91.
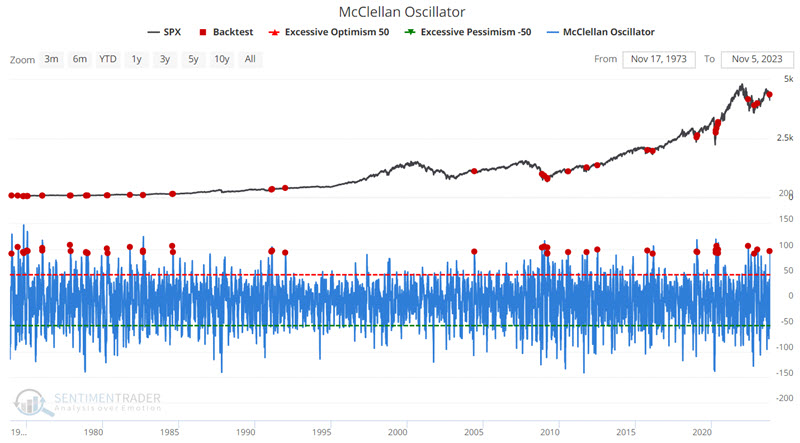
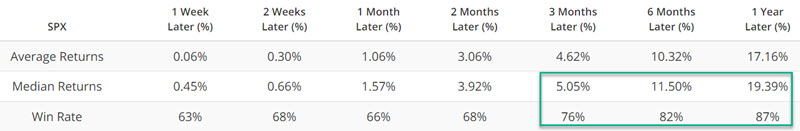
While many interpret this action as indicating an "overbought" market, the results suggest that this type of strength is more often an indication of a powerful thrust higher based on an expansion in the number of stocks participating in the accompanying rally. The table below displays S&P 500 performance following all crosses above 91% since 1962.
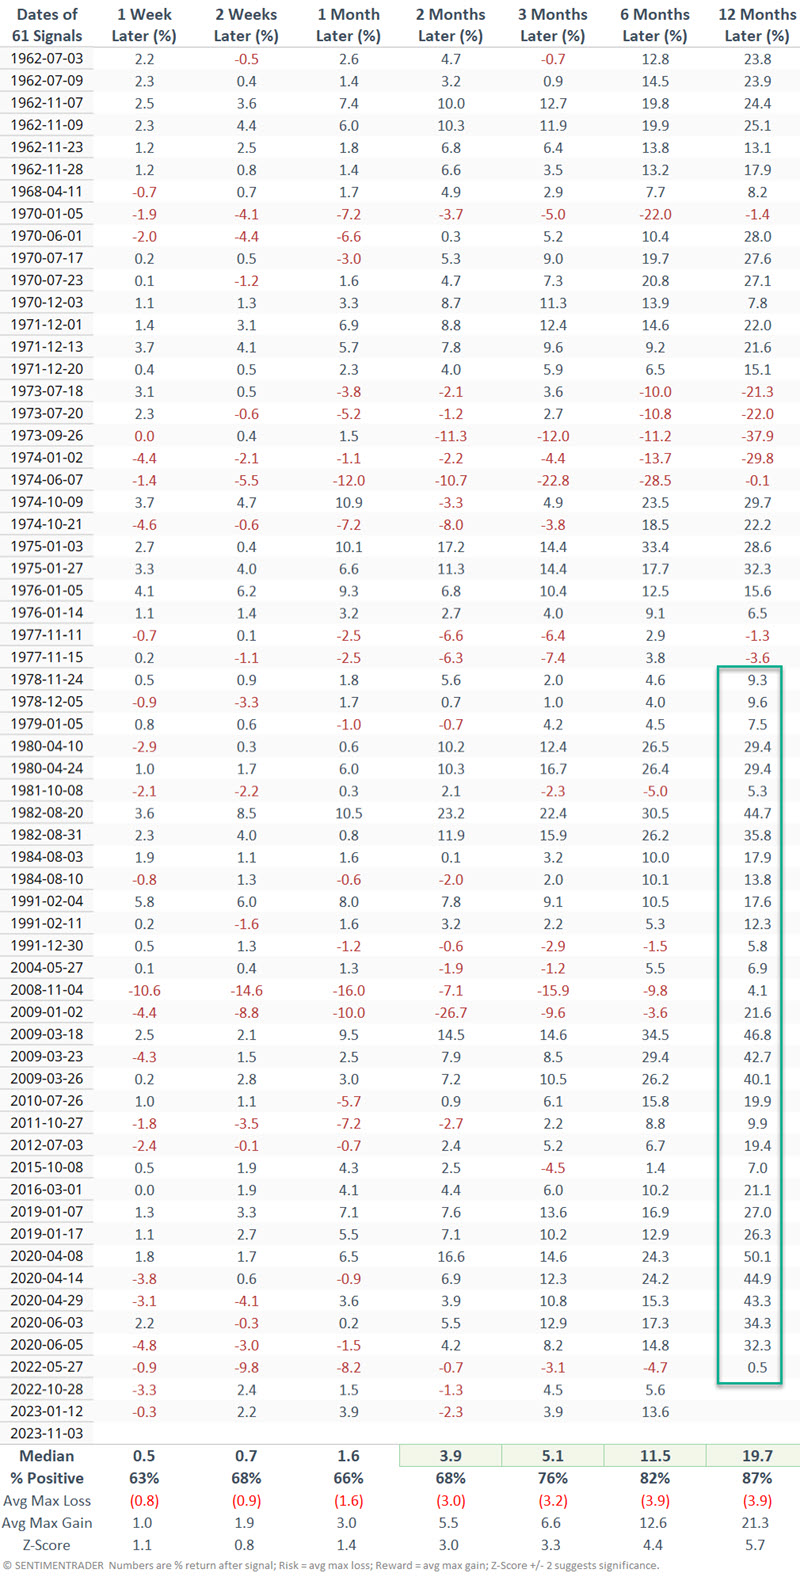
Two things to note:
- The 1973-09-26 signal saw the S&P 500 plummet -38% in the next twelve months
- That said, the last 32 signals (starting on 1978-11-24) have seen the S&P 500 higher twelve months later, with a median gain of +20%.
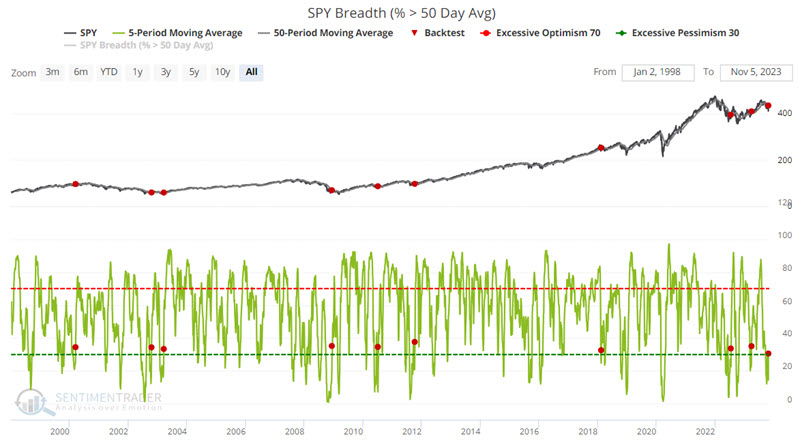
SPY Breadth flashes a favorable alert
As the name implies, the SPY Breadth (% > 50-day Avg) measures the percentage of S&P 500 Index constituent stocks currently trading above their respective 50-day moving average.
The chart below highlights those dates when the SPY Breadth (% > 50-day Avg) indicator crossed above 30% while the ticker SPY was above its 50-day moving average. This configuration highlights the market coming off an oversold level while in an uptrend.
The table below displays the subsequent performance for ticker SPY.
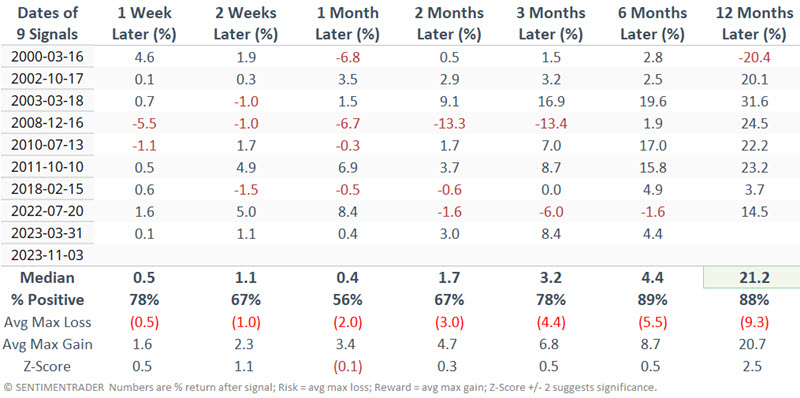
The 2000-03-16 signal serves as a reminder that no one indicator or signal should be relied upon 100% as a standalone trading model. Nevertheless, as a weight of the evidence piece of the puzzle, the 2023-11-03 signal serves as another item falling firmly on the favorable side of the ledger.
What the research tells us…
No single indicator should ever be thought of as the "holy grail" or a "magic bullet." Even indicators with solid long-term track records can eventually generate a signal followed by subpar results. The purpose of tracking multiple breadth indicators is to highlight unique circumstances. When breadth reaches a certain level, it often acts as thrust for the market, much like a rocket providing thrust to get a spaceship out of the earth's atmosphere.
Neither of the signal indicators above guarantees that the stock market will be higher twelve months from now. But history suggests that investors consider continuing to give the bullish case the benefit of the doubt.