
Two more major index indicators flashing green

Key points
- Seasonality remains a short-term concern (see here, here, and here), but momentum indicators continue to be positive for stocks
- The % of S&P 1500 stocks showing strong momentum just flashed green
- Likewise, our Nasdaq High/Low Ratio indicator crossed a favorable threshold
- This adds to the previous list of previously favorable momentum indicators (see here, here, and here)
% S&P 1500 RSI 14-day > 70 momentum is favorable
Precisely as the name implies, the % S&P 1500 RSI 14-day > 70 indicator tells us what percentage of stocks that comprise the S&P 1500 index are presently showing a 14-day RSI reading of 70% or more. Intuitively, it is natural to think of a high reading as suggesting an " overbought market." However - like many things with the markets, what seems intuitive is not always correct.
As it turns out, a high reading from this indicator often indicates strong momentum underlying the market. It can be beneficial if we also filter for price trends. The chart below highlights all dates when:
- The 20-day moving average for the % S&P 1500 RSI 14-day > 70 indicator crossed above 6.2%
- While the S&P 500 index was above its 200-day moving average
- For the first time in three months
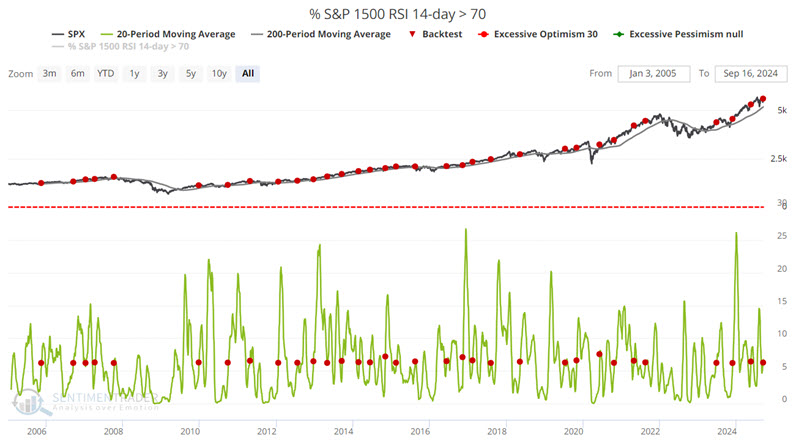
The most recent signal occurred on 2024-09-12. The table below displays subsequent S&P 500 performance following all of the dates highlighted in the chart above.
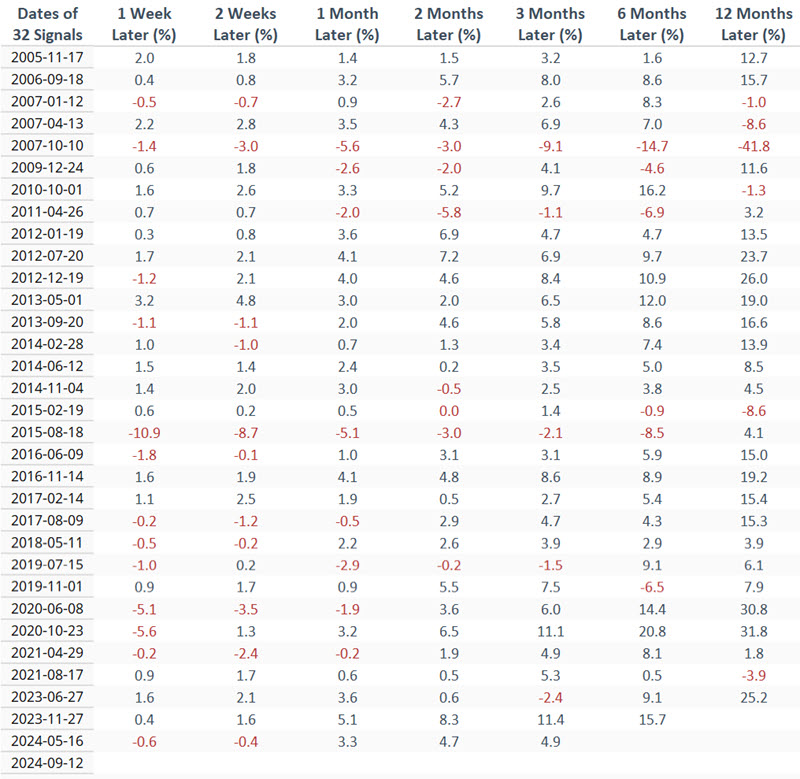
The table below summarizes the S&P 500 index results following signals.
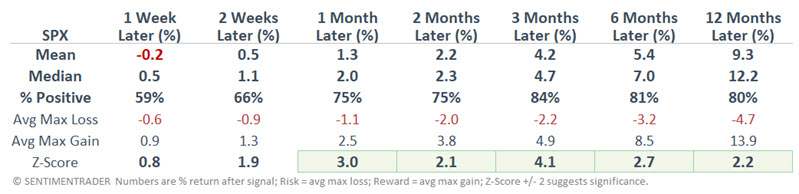
Like most indicator signals, this one is no "sure thing." However, as a weight of the evidence tool, it shows solid and above-average market performance virtually across the board-if not necessarily spectacular. The latest signal does not mean the market cannot experience a significant decline in the future (the 2007-10-10 signal is the prime outlier example). However, as long as price action remains remotely favorable, this indicator suggests that investors continue to give the bullish case the benefit of the doubt.
The Nasdaq High/Low Ratio crosses a favorable threshold
This indicator is a breadth ratio constructed from the New High / New Low ara. New highs are the number of NASDAQ issues that closed at a new 52-week high today. New lows are the number of NASDAQ issues that reached a new 52-week low as of today's close. The number of issues that closed at a new high is expressed as a percentage of the total (we also present the ratio chart for the Nasdaq).
The chart below highlights all dates when:
- The 20-day moving average of the Nasdaq High/Low Ratio crossed above 0.559
- While the Nasdaq 100 Index was above its 200-day moving average
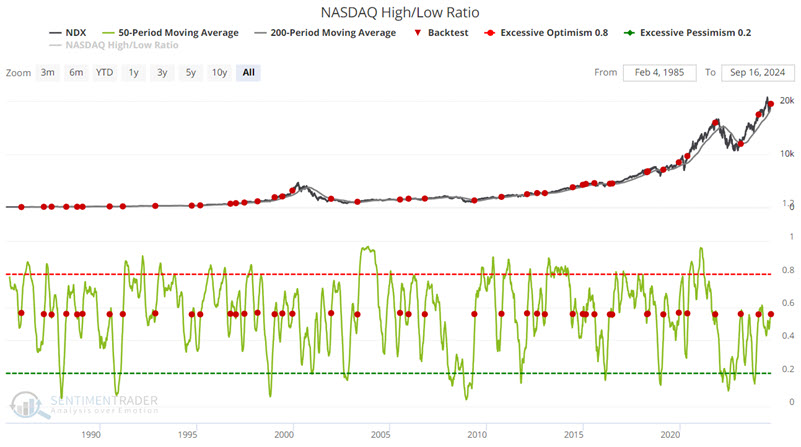
The most recent signal occurred on 2024-09-16. The table below displays subsequent Nasdaq 100 performance following the dates highlighted in the chart above.
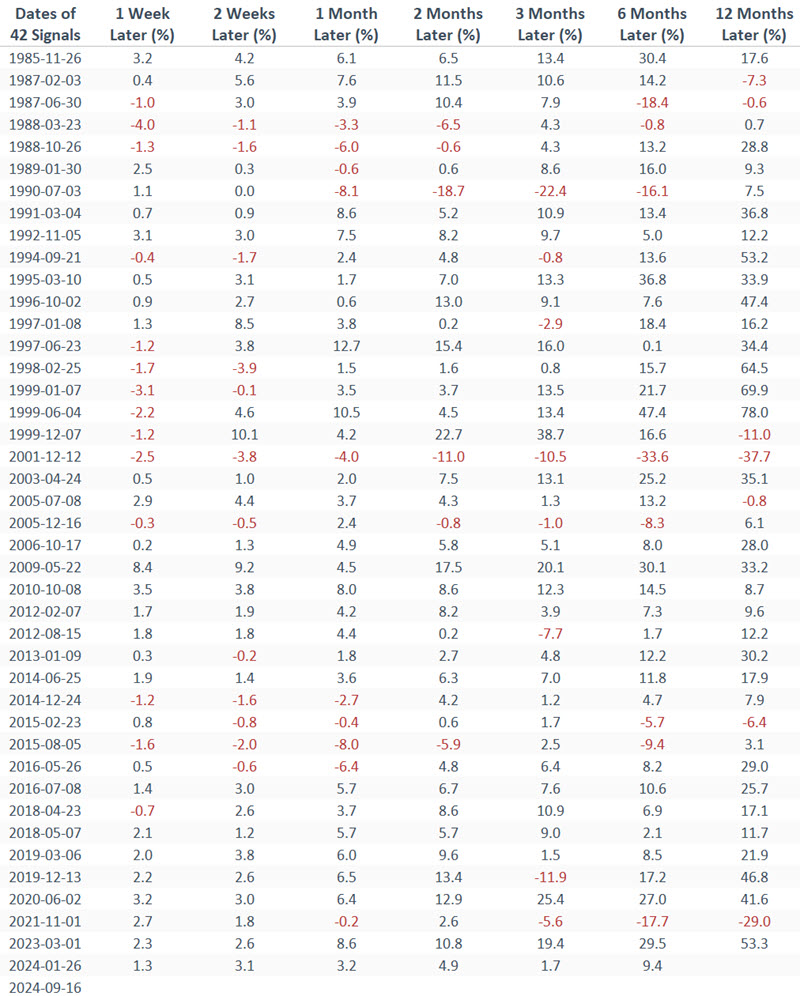
The table below summarizes the Nasdaq 100 index results following signals.
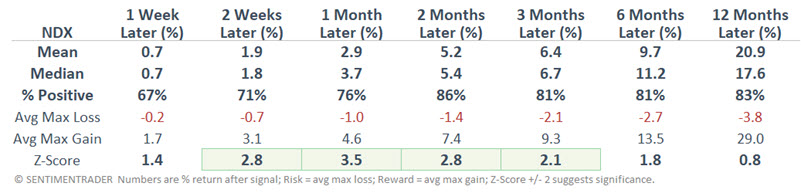
Just like the S&P 500 indicator above, the results here are solid across the board. Still, the usual caveats apply (see the 2001-12-12 and 2021-11-01 signals).
What the research tells us…
The message from the indicators above is NOT "All clear, nothing but blue skies and smooth sailing ahead." The message is that the trend right now is favorable. While I have highlighted several seasonal concerns lately (see here, here, and here), the indicators highlighted in this piece suggest that longer-term investors use any near-term weakness as a buying opportunity unless and until the major market indexes show some signs of actual weakness.