
Two more indicators flash favorable continuation signals

Key points
- Favorable indicator signals should be thought of as "weight of the evidence" and not as automatic "buy signals"
- Still, when a variety of typically reliable indicators generate favorable signals within a short time, it often signifies a buying opportunity for stocks
- Our Smart Money/Dumb Money and Microcap / S&P 500 Relative Ratio Rank indicators recently flashed "continuation" signals
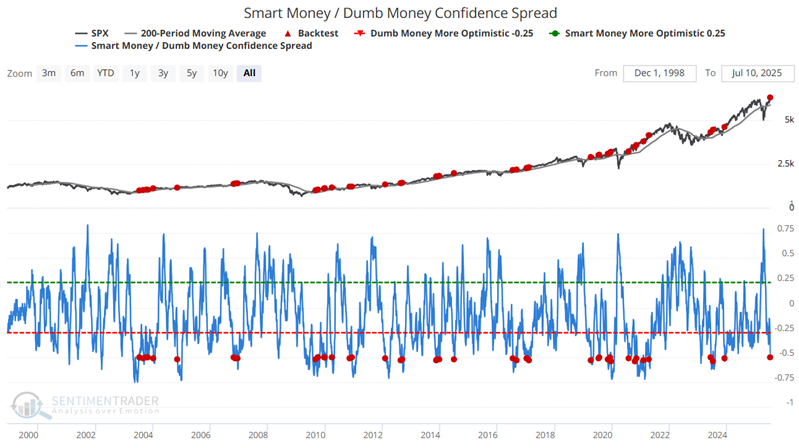
Smart Money/Dumb Money flashes a continuation signal
The Smart Money Confidence and Dumb Money Confidence indices are a unique innovation that allows subscribers to see at one quick glance what the "good" market timers are doing with their money compared to what "bad" market timers are doing.
The chart below highlights all dates when:
- The S&P 500 Index is above its 200-day moving average
- The 200-day moving average is rising
- The Smart Money/Dumb Money Confidence Spread crosses below -0.50
The most recent signal occurred on 2025-07-09.
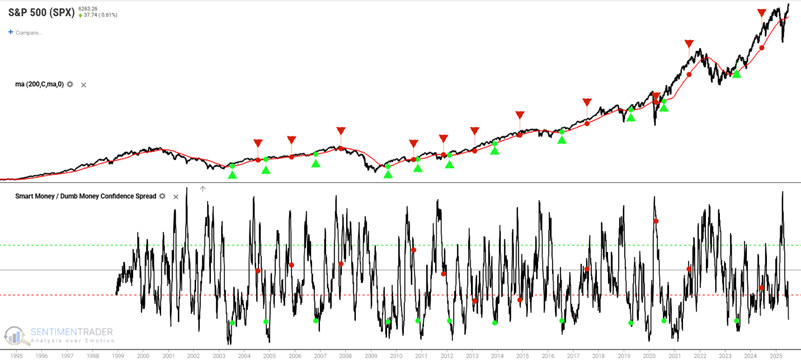
The chart below highlights all signal dates, including overlaps.
The table below summarizes the S&P 500's performance following the dates highlighted in the chart above. The key point to note is the 98% Win Rate one year later.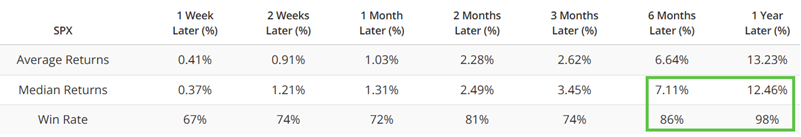
Next, let's apply a more systematic approach. Using this approach, we will buy and hold the S&P 500 for one full year after a signal and ignore any intervening signals. The chart below shows the trading signals.
The tables below summarize results and display trade-by-trade results (using a one-year holding period).
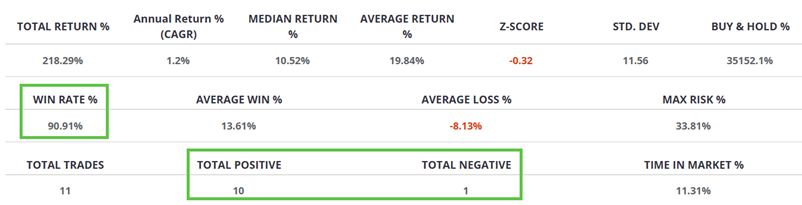
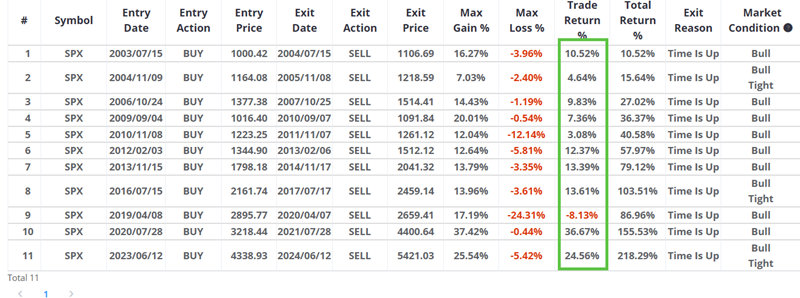
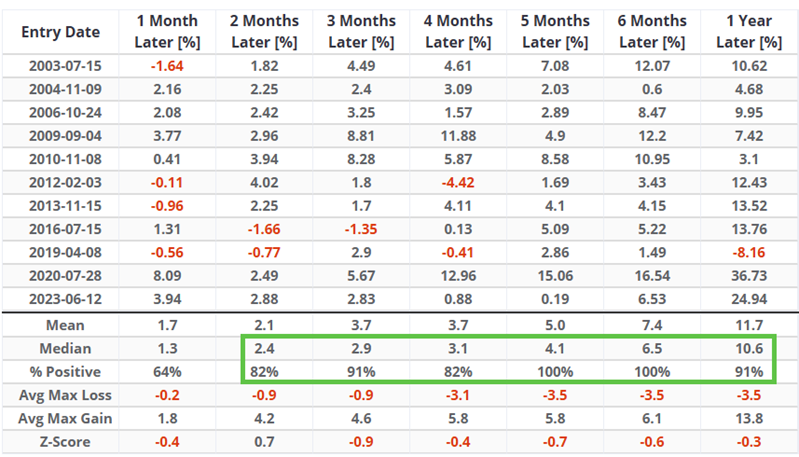
The table below displays S&P 500 results for different timeframes. Note the high Win Rates for 2 months to 1 year.
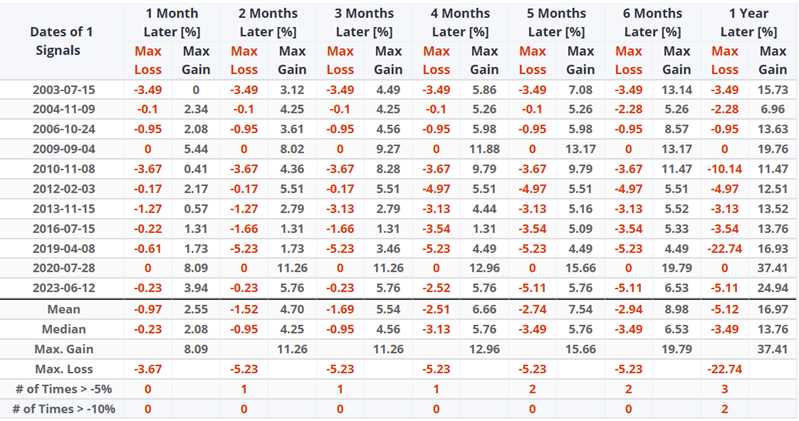
The table below shows the maximum gain and loss experienced during each trade.
Finally, the chart below displays the hypothetical equity growth for this systematic approach. While not perfect, the results do trend from lower left to upper right.
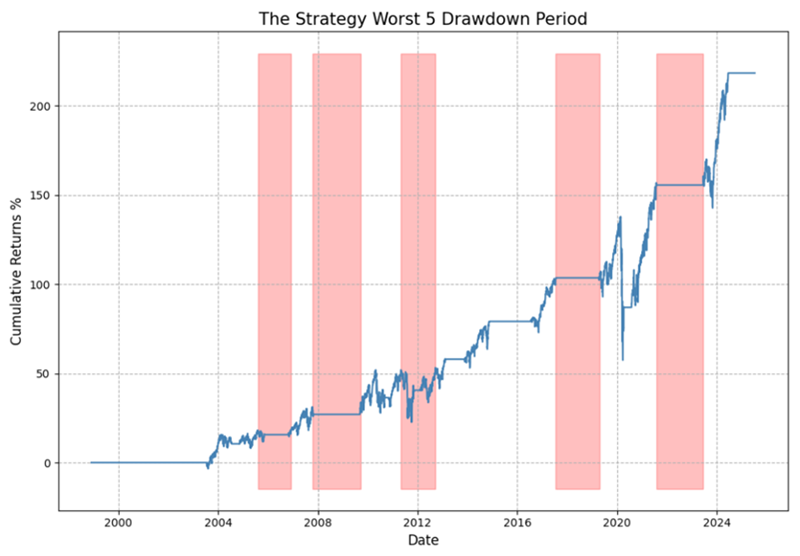
Should this method be used as a standalone trading model? Not necessarily. However, the lower-left to upper-right nature of returns, and the tendency to miss significant declines (2008, 2015-2016, 2018, 2022) are meaningful positives.
An important signal from Microcaps
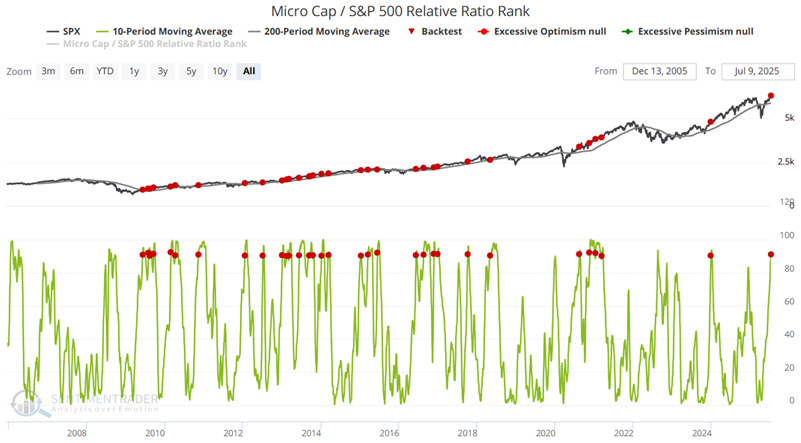
The Microcap / S&P 500 Relative Ratio Rank chart shows where the ratio is relative to its range over the past four months. When the relative ratio is high, investors are showing risk-on behavior. When the ratio drops to a low level, they exhibit risk-off behavior.
The chart below highlights all dates when:
- The S&P 500 Index is above its 200-day moving average
- The Microcap / S&P 500 Relative Ratio Rank crosses above 90%
The most recent signal occurred on 2025-07-09.
The chart below highlights all signal dates, including overlaps. Once again, we see a signal that tends to occur during an ongoing bull market.
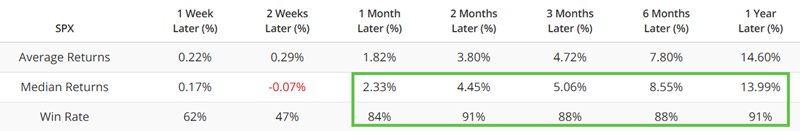
The table below summarizes S&P 500 performance following the dates highlighted in the chart above. Win Rates are 84% and higher for all timeframes from 2 months to 1 year.
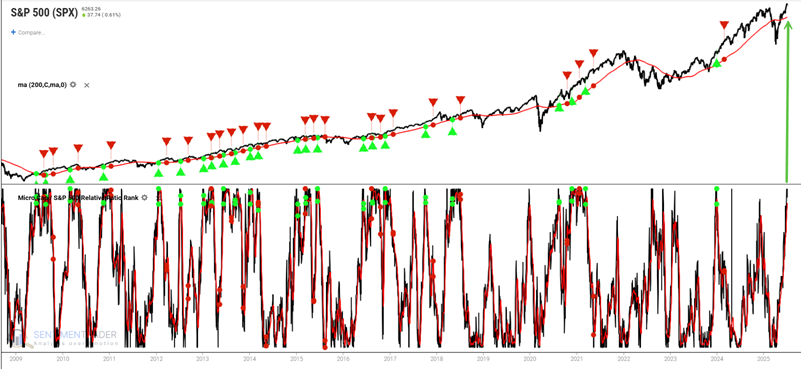
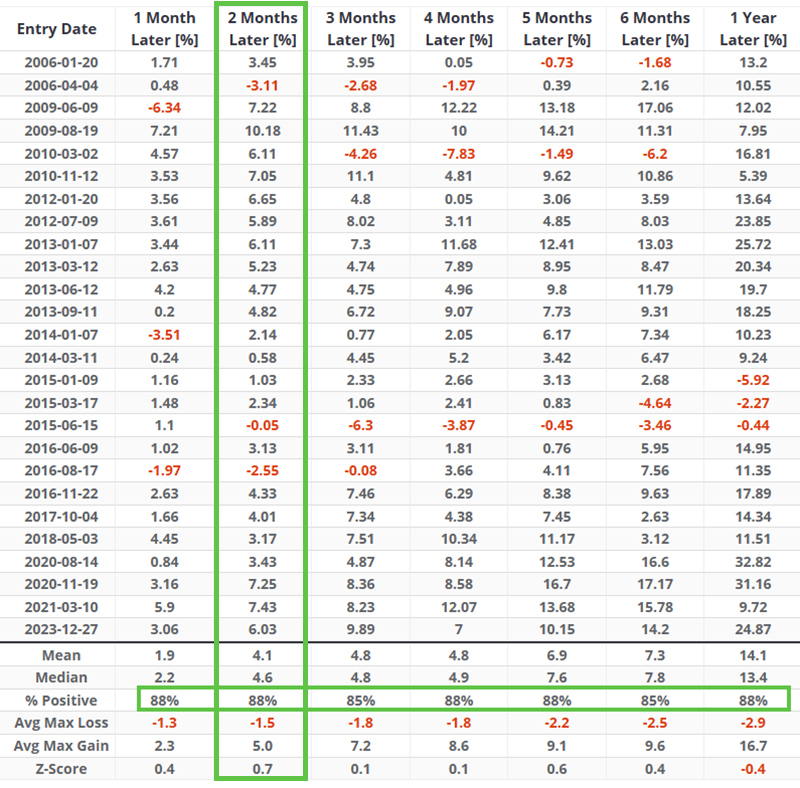
Next, let's apply a systematic approach. Using this approach, we will buy and hold the S&P 500 for two months after a signal and ignore any intervening signals. The chart below shows the trading signals.
The table below summarizes results using a two-month holding period.
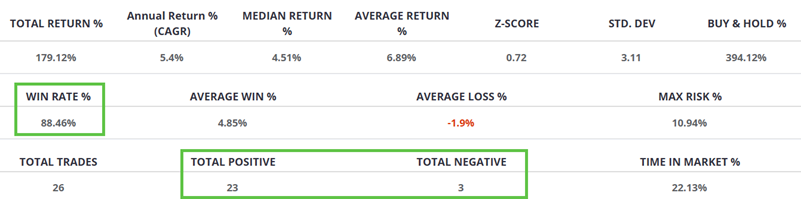
The table below displays S&P 500 results for different timeframes. Note the high Win Rates for 2 months to 1 year.
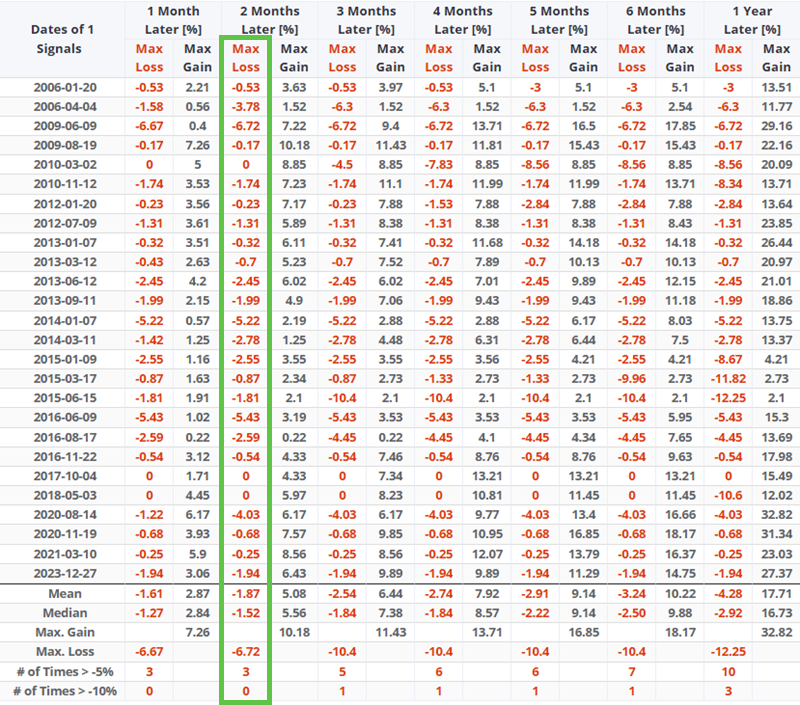
The table below shows the maximum gain and loss experienced during each trade.
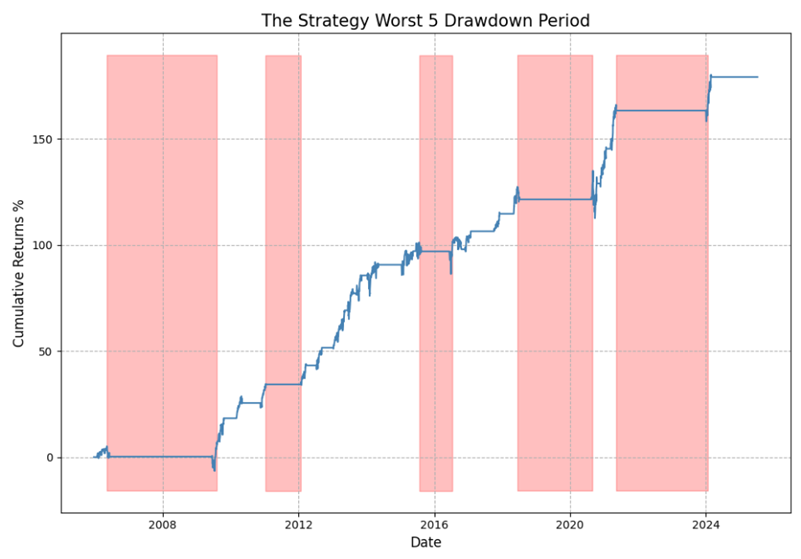
Finally, the chart below displays the hypothetical equity for this systematic approach. While not perfect, the results do trend from lower left to upper right, and significant declines are rare.
What the research tells us…
Both of the signals highlighted above fall into the "continuation" signals category. That is, they lend weight to the bullish case when they trigger. Do the recent signals guarantee higher stock prices two months (in the case of the Microcap signal) or one year (in the case of the Smart Money/Dumb Money signal)? Not at all. But they do suggest that that is the way to bet for now.