
Two more green lights for stock market plus one shorter-term yellow light

Key points
- Industry Breadth recently flashed a favorable trend-following signal
- The AAII Bull Ratio also recently flashed a favorable trend-following signal
- One measure of our Fear & Greed Model, however, recently flashed yellow for the months directly ahead
The Industry Breadth (% > 200d avg) indicator crosses a significant level
The chart below shows the percentage of 23 industries trading above their 200-day moving averages. The upward spike in the indicator value has many shouting "overbought" warnings.
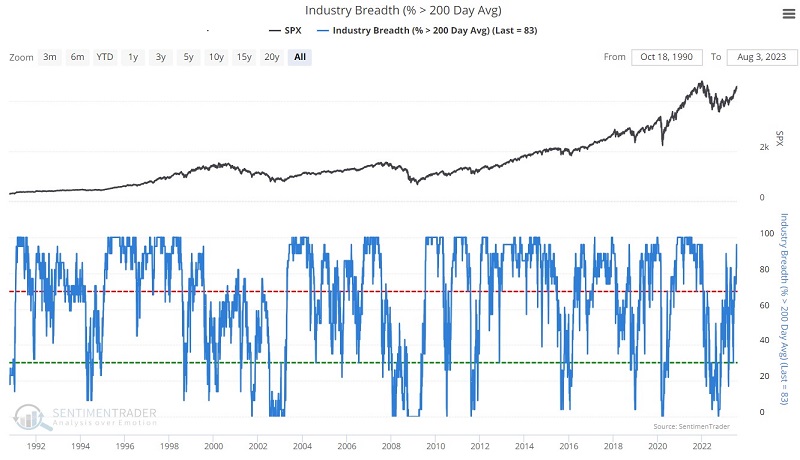
As you can see above, this percentage spiked to a very high level during the latest market rally. Human nature being what it is, this action reflexively causes many investors to react cautiously - "The market is overbought; I'd better not chase it!" But is this response warranted? Let's look at actual market history to answer that question.
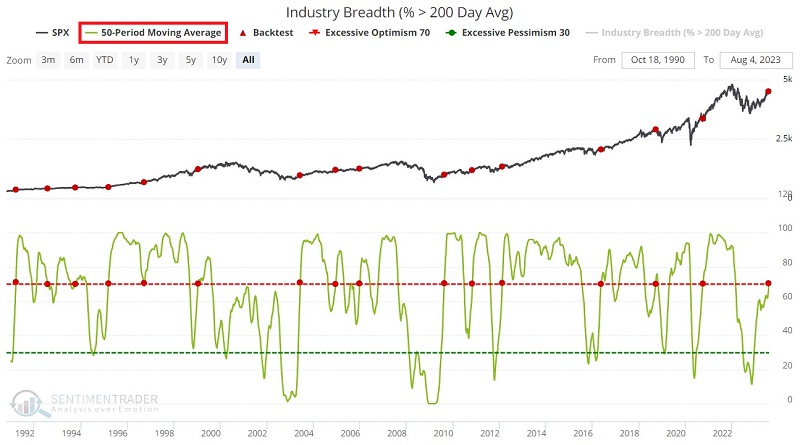
The chart below displays those times when the 50-day average of the indicator crossed above 70 for the first time in twelve months. The most recent signal occurred on 2023-08-03.
The table below displays S&P 500 performance following previous signals.
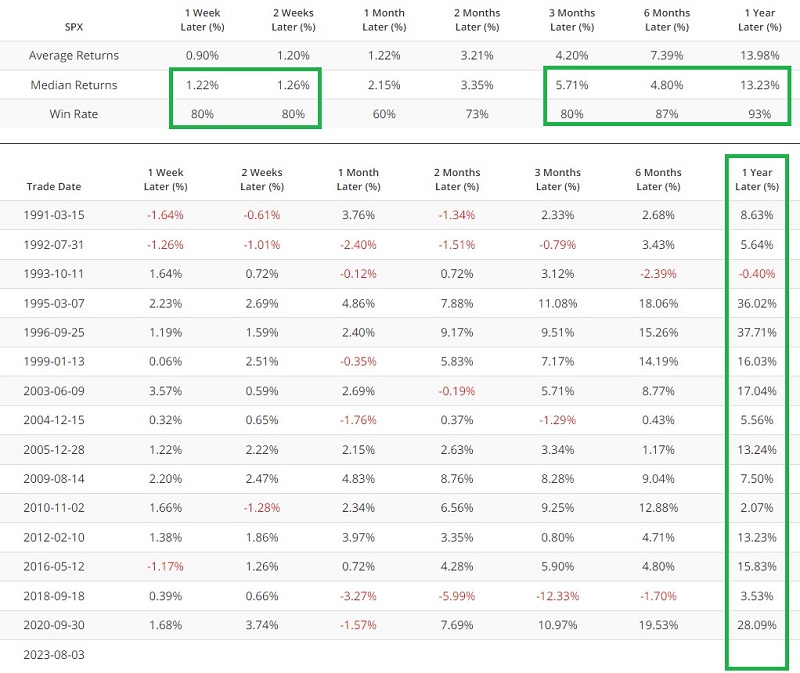
While there are never any guarantees, the results are encouraging for investors hoping for a continuation of the rally in the first half of 2023. Following the previous 14 signals, the only subsequent 12-month loss occurred following the 1993-10-11 signal and saw the S&P 500 close down -0.40% twelve months later. Not enjoyable, but also hardly disastrous.
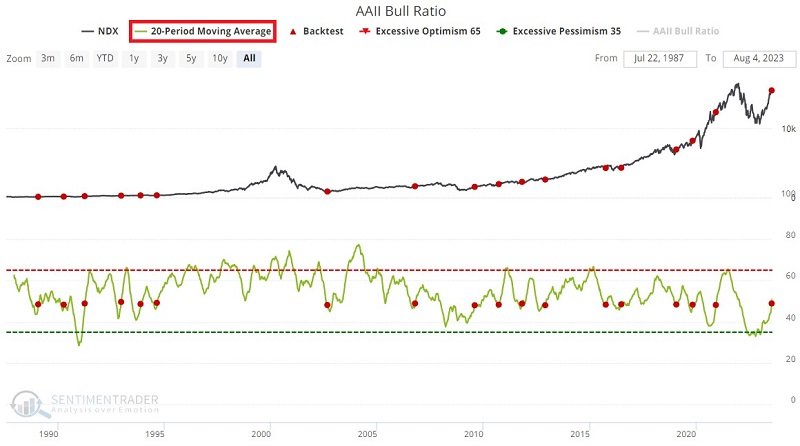
AAII Bull Ratio Rises
The AAII (American Association of Individual Investors) is a non-profit organization headquartered in Chicago and was founded in 1978. Their niche market is individual investors, not professional traders, pension funds, or anything else institutional. Their focus, and most of their membership, is long-term fundamental analysis of sound companies using minimal technical analysis for decision-making purposes.
The AAII sentiment survey is a weekly poll conducted by that organization that intends to gauge the overall sentiment of their membership. They ask their membership where they think the market will be in six months and group the responses into bullish, bearish, or neutral categories. This indicator is a Bull Ratio, calculated by:
BULL RATIO = (BULLS / (BULLS + BEARS))
Like most contrarian indicators, when the survey shows too many investors as bullish, it often corresponds to market highs. Conversely, too many bears suggest the market may soon find a low. After bottoming in the teens in 2022, the recent market rally finally triggered a surge in individual investor bullishness, as highlighted at the far right in the chart below.
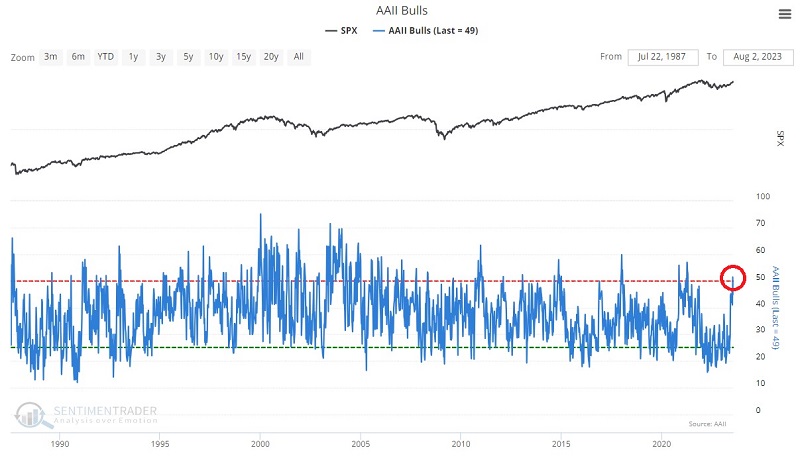
This recent spike in this indicator's reading has triggered the usual dire "Bullish sentiment is getting overdone" warnings from many market pundits. Once again, the question is, 'Is this concern warranted?" And once again, let's let market history answer the question.
The chart below displays those times when the 20-week average of the indicator crossed above 48 for the first time in 26 weeks. The most recent signal occurred on 2023-07-26.
The table below displays S&P 500 performance following previous signals.
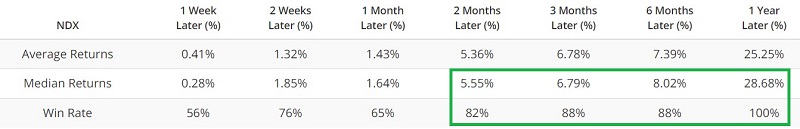
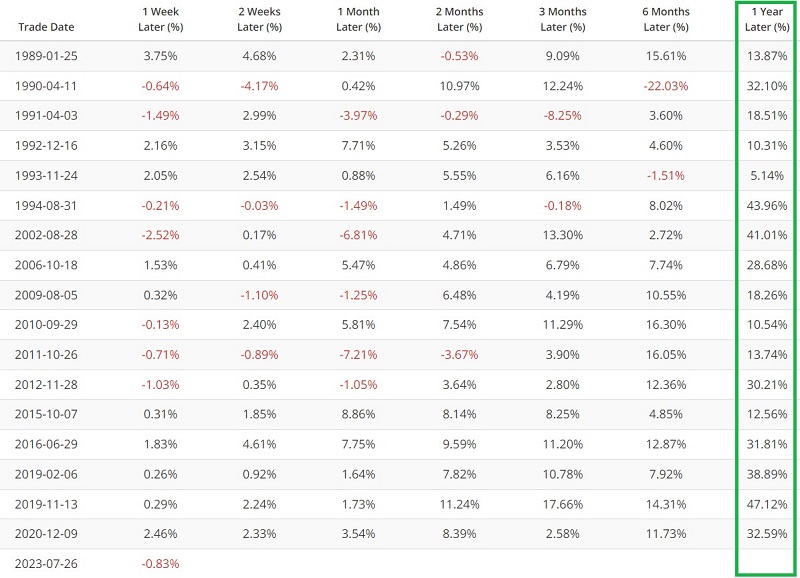
As it turns out, a rising trend that follows a reversal from a low level has generally been a good thing for the market. This reminds us that "former bears turning into bulls" is necessary to sustain a bull market.
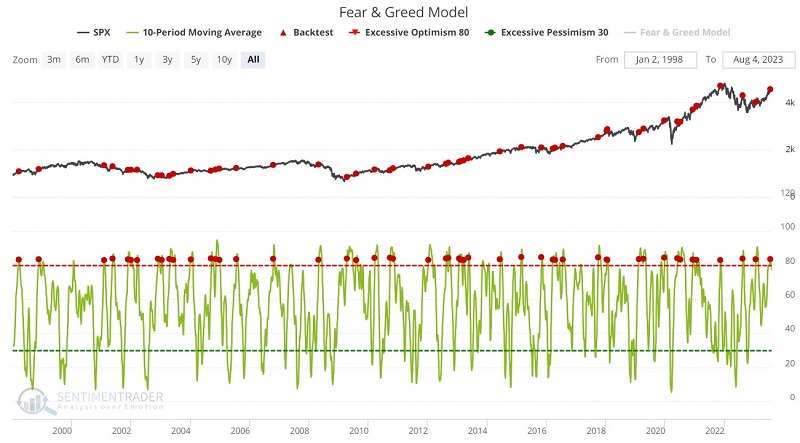
One measure of Fear & Greed flashes yellow
While the two indicators above suggest market strength over the next twelve months, another measure of the recent spike in bullish sentiment suggests that a period of correction, consolidation, and potentially increased volatility may lie in the months directly ahead. However, history suggests it should not be considered a warning of an impending bear market.
This model is based on the one published by CNN on their public website. This is our calculation of the model based on the inputs discussed on their website. It does not reflect the values published by CNN. Instead, it is our interpretation of the model. It should be interpreted similarly to other sentiment indicators and models, with rising optimism being good for stocks until it reaches extreme optimism, in which case it becomes a contrary indicator the more optimistic it gets. The inverse is also true, with declining optimism being a negative for stocks until it reaches an extreme, in which case it begins being a contrary, positive indicator.
The chart below displays when the 10-period average of our Fear & Greed Model crossed above 83%. The most recent signal occurred on 2023-07-24.
The table below summarizes S&P 500 performance following previous signals.
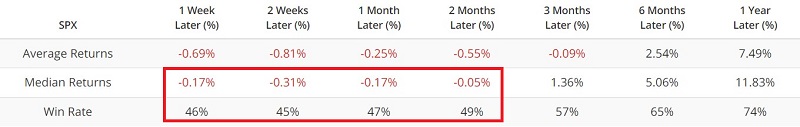
The results following previous signals suggest the potential for some choppiness and consolidation into September or October.
What the research tells us…
The number of indicators that have given favorable trend-following and/or breadth thrust signals continues to grow. This bodes well for the potential that the rally in the first part of 2023 has legs and can continue to run. Nevertheless, trees don't grow to the sky, and even the strongest bull markets experience periods of consolidation, pullbacks, and occasionally worrisome volatility. The first two indicators discussed above reassure long-term investors to stay the course. The third indicator reminds us that the stock market is never a one-way street.