
Two more breadth and sentiment indicators arguing "normal correction"

Key points
- The stock market often struggles in the late August-mid-October period
- Still, a host of indicators suggest that the recent decline is a normal correction
- The % of SPY constituent stocks making a new high just flashed a favorable oversold signal
- The Equity Put/Call Ratio also reached a moderately favorable reading
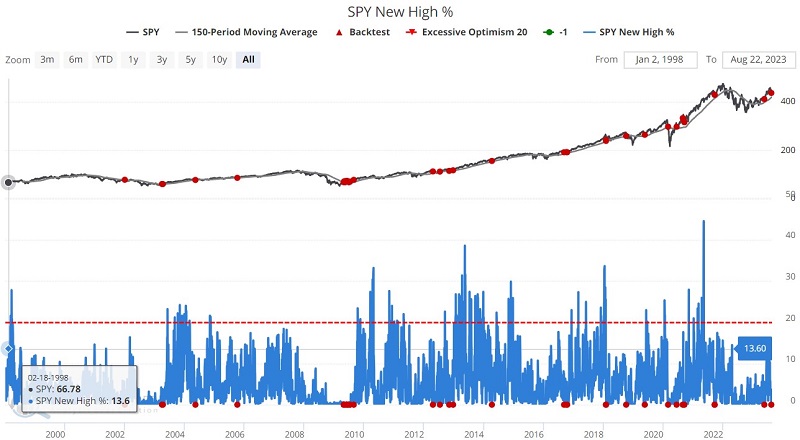
SPY New High %
The SPY New High % indicator shows the percentage of stocks in the S&P 500 Index currently trading at a new 52-week high. Like many indicators, interpreting different readings is not always intuitive. The bad news is that this indicator plunged to 0% on 2023-08-18. The good news is that this happened while ticker SPY was above its 150-day moving average.
Why is this good news? The chart below highlights all dates when the SPY New High % indicator touched 0% while SPY was above its 150-day moving average.
The table below displays a summary of post-signal SPY performance. The key things to note are the exceptional Win Rates from 1-month to 12 months and the high Median Returns for six months to 1-year.
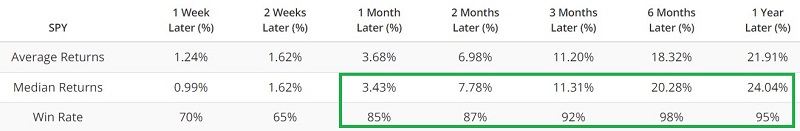
The caveat is that the double-digit percentage declines following the signals in January 2002 and September 2021 remind us that no single indicator can be relied on 100%.
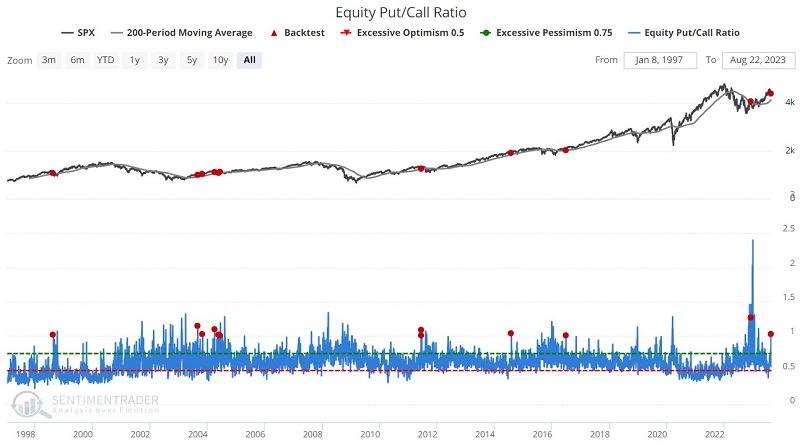
Equity Only Put/Call Ratio
The Equity Only Put/Call Ratio is the volume of puts divided by the volume of calls traded on individual equities on the CBOE (Chicago Board Options Exchange) on a given day. All index and ETF options (which are often used in hedging strategies) are ignored.
The chart below highlights all dates when the Equity Put/Call Ratio crossed above 1% while the S&P 500 Index was above its 200-day moving average.
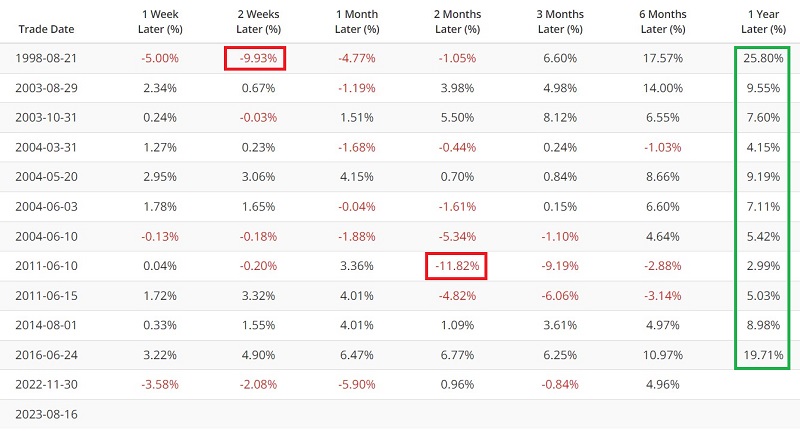
The table below displays a summary of post-signal SPX performance.
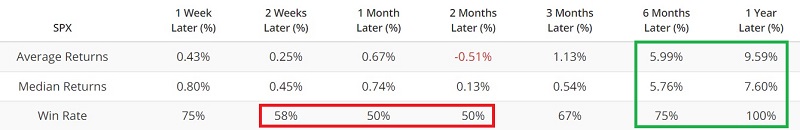
The results do not exactly "knock your socks off." Win Rates from 2 weeks to 2 months are essentially a coin flip. And while 6-month and 12-month Win Rates are 75% and 100%, respectively, the Median Returns are modest at +5.76% and +7.60%, respectively.
So, the results from this particular signal do not necessarily scream "buy signal." On the other hand, none of the previous signals were followed by a significant bear market. The worst declines - as shown in the table below - were a 2-week decline of -9.93% following the 1998-08-21 signal (which was followed by a massive rally) and a 2-month -11.82% decline following the 2011-06-10 signal (which ultimately rebounded to a gain over the next ten months).
So, while the latest signal may not necessarily say "big bull market," it does argue in favor of "no big bear market" in the year ahead.
What the research tells us…
History suggests a potential for seasonal stock market weakness between now and mid-October. Likewise, the above indicators should likely not be relied upon as "buy signals" or standalone trading models. Nevertheless, a broad array of breadth indicators - including the ones detailed above (and these) - still point towards a standard correction within a more significant uptrend (as long as the major stock indexes remain above their respective long-term moving averages.