
Two indicators suggest that investors have panicked (and why that may be a good thing)

Key points
- Our Panic/Euphoria Model recently highlighted a significant amount of fear among investors
- A risk on/risk off measure of High Beta vs. High-Quality stocks also identified a "flight to safety"
- Many indicators can generate useful signals across a variety of parameter values
Panic/Euphoria Model flashes a green light
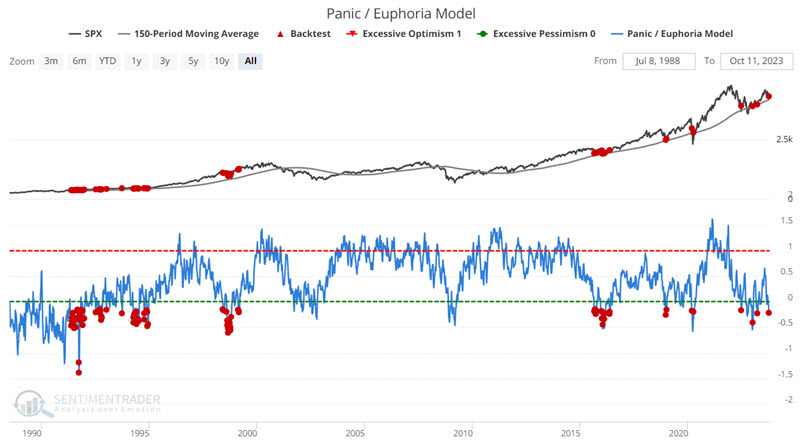
Our Panic/Euphoria Model is based on the Citi Panic / Euphoria model published in Barron's magazine. It does not reflect those published values; instead, it is our interpretation of the model inputs and construction and differs modestly from the published figures. The inputs are the same. However, its performance as a contrary indicator is improved over the published values. It is composed of the following primary inputs: NYSE short interest, margin debt, Nasdaq vs NYSE volume, Investor's Intelligence survey, AAII survey, retail money market funds, put/call ratios, commodities prices, and retail gasoline prices. The higher the model, the more investors are in a euphoric mood, with lower expected stock returns going forward. Low values, particularly below zero, suggest investors have panicked, and higher forward returns are expected.
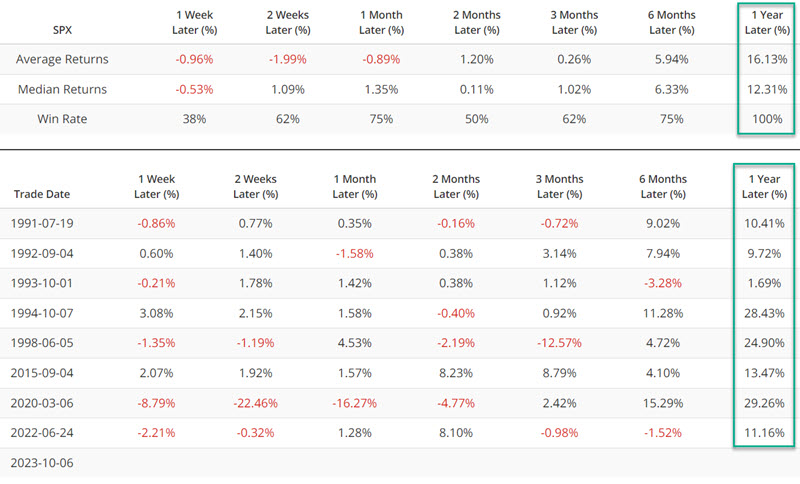
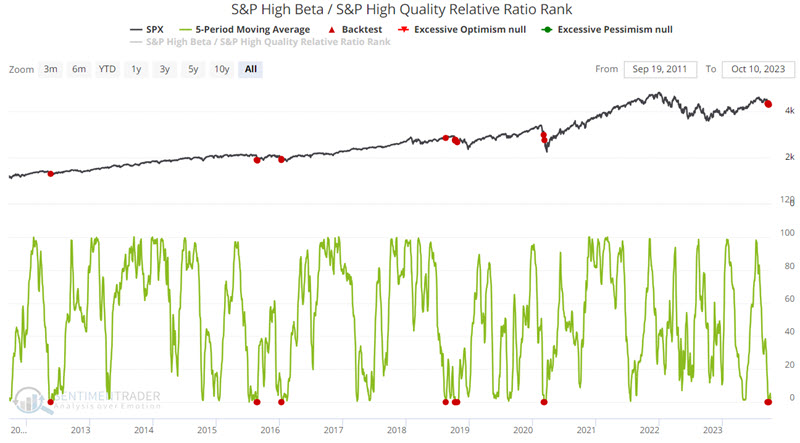
The chart below highlights all dates when our Panic/Euphoria Model was below -0.15 while the S&P 500 Index was above its 200-day moving average (i.e., a pullback in an uptrend). The most recent signal occurred on 2023-10-06.
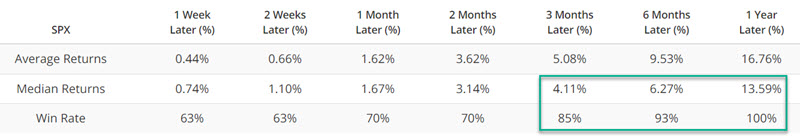
The table below summarizes subsequent S&P 500 performance.
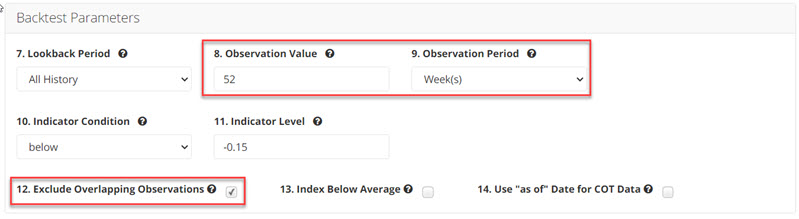
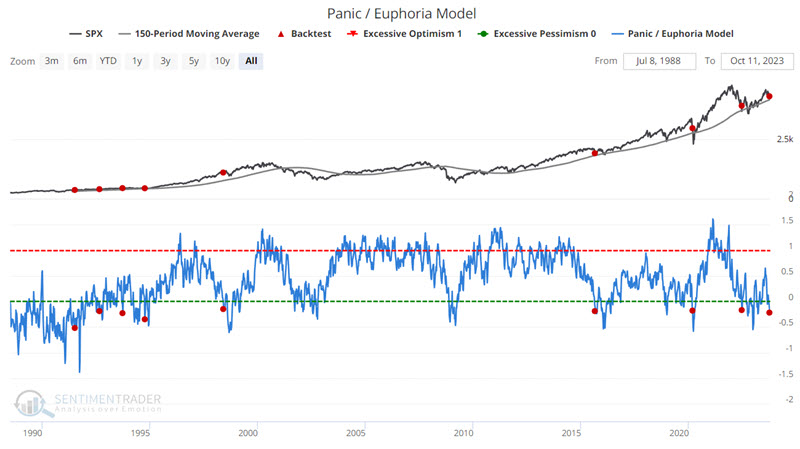
Let's alter the parameters to eliminate many duplicate signals from the test above. The chart below again highlights those dates when our Panic/Euphoria Model was below -0.15 while the S&P 500 Index was above its 200-day moving average, BUT uses the settings shown in the screenshot below to limit the test to one signal per 52 weeks. The most recent signal occurred on 2023-10-06.
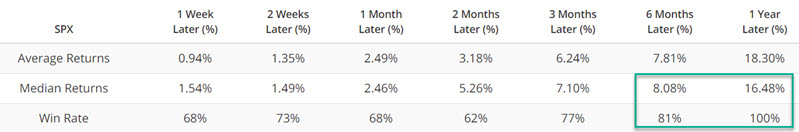
The table below summarizes subsequent S&P 500 performance.
Results from 1-week to 6-months are mixed, but 12-month returns have (so far) historically been quite consistent and suggest that investors give the bullish case the benefit of the doubt.
High Beta versus High Quality indicating some signs of panic
We covered one iteration of this indicator previously on 2023-09-25. Our S&P High Beta / S&P High-Quality Relative Ratio Rank indicator shows where the ratio is relative to its range over the past four months. One sign of growing fear in the market is signaled by a decline in the performance of high beta (i.e., more volatile, high-risk, high-reward types of stocks) relative to high-quality stocks. A sharp decline in the S&P High Beta / S&P High-Quality Relative Ratio Rank indicator can signal a "flight to safety" as investors abandon volatile stocks for the perceived safety of higher-quality stocks. Extreme readings can highlight an important increase in investor bearish, which in turn can serve as a bullish signal for stocks.
Let's consider some different ways to apply this indicator. Repeating from the earlier article, the chart below highlights those dates when the 5-day moving average of the S&P High Beta / S&P High-Quality Relative Ratio Rank equals 0. The most recent signal occurred on 2023-09-27.
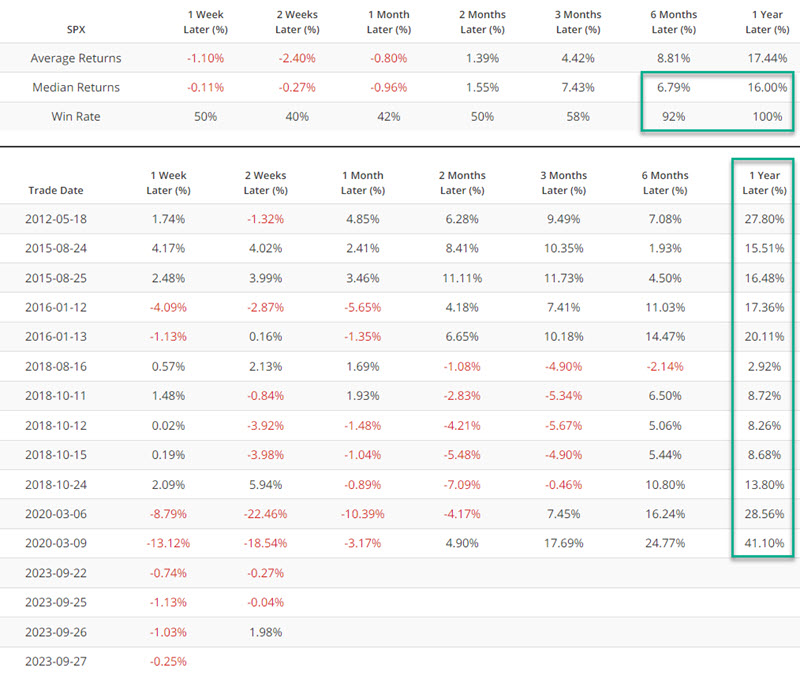
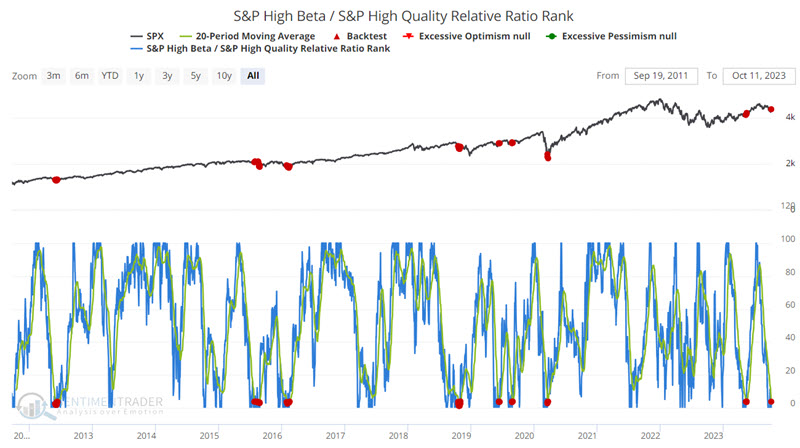
Now, let's look at another variation for this indicator. Instead of using a 5-day moving average, we will use a 20-day moving average. The chart below highlights all dates when the 20-day moving average for the S&P High Beta / S&P High-Quality Relative Ratio Rank indicator was below 4.0. The most recent signal occurred on 2023-10-10.
Again, the six and 12-month results have shown a consistently high Win Rate.
What the research tells us…
Many indicators can be used differently (i.e., there is no "one sure-fire best" set of parameters). Not every squiggle from every indicator means something. Likewise, not every indicator signal should be relied upon as a "buy" or "sell" signal. We generally prefer a weight-of-the-evidence approach. When a meaningful number of generally reliable indicators flash similar signals within a given period, it often (though notably, not always) provides an essential clue for investors looking to cut through the latest narrative in the financial news. The flurry of signals from the indicators highlighted above adds weight to the favorable side of the ledger.