
Two indicators just flashed "continuation" signals (and why you should care)

Key points
- "Continuation" signals can put an investor's mind at ease and also tell them when to commit available cash to the market
- The Nasdaq High/Low Ratio recently rebounded from a pullback
- Our Aggregate Signal Model has once again confirmed an existing uptrend
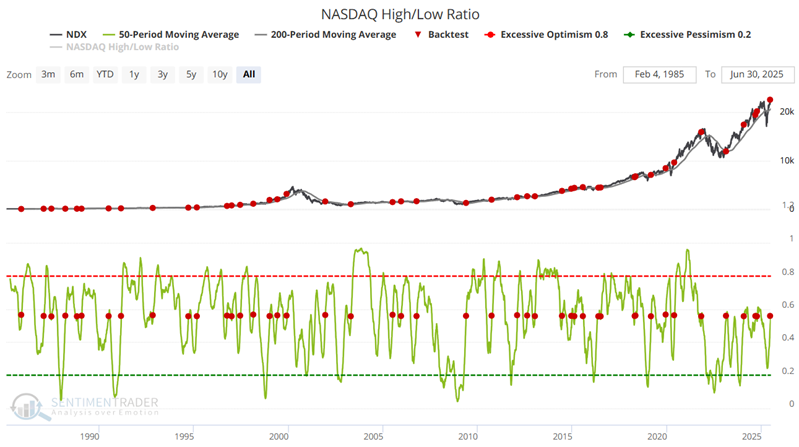
The Nasdaq High/Low Ratio with a "continuation" signal
Not every indicator signal is intended to be a standalone trading system. Likewise, not every indicator signal is designed to "pick a bottom." One useful alternate category is referred to as the "continuation" signal. These signals can occur frequently or infrequently and tend to signal that an ongoing bull market is still intact. One example of this type of signal involves our NASDAQ High/Low Ratio indicator.
The chart below highlights those dates when the 50-day average of the NASDAQ High/Low Ratio crossed above 0.56 and the Nasdaq 100 Index is above its 200-day moving average. This scenario essentially marks a situation when breadth is rebounding from a period of short to intermediate term weakness (the 50-day average of the High/Low ratio dropped below 0.56 and is now once again trending higher) while price action is in an objective uptrend (Nasdaq 100 is above its 200-day moving average).
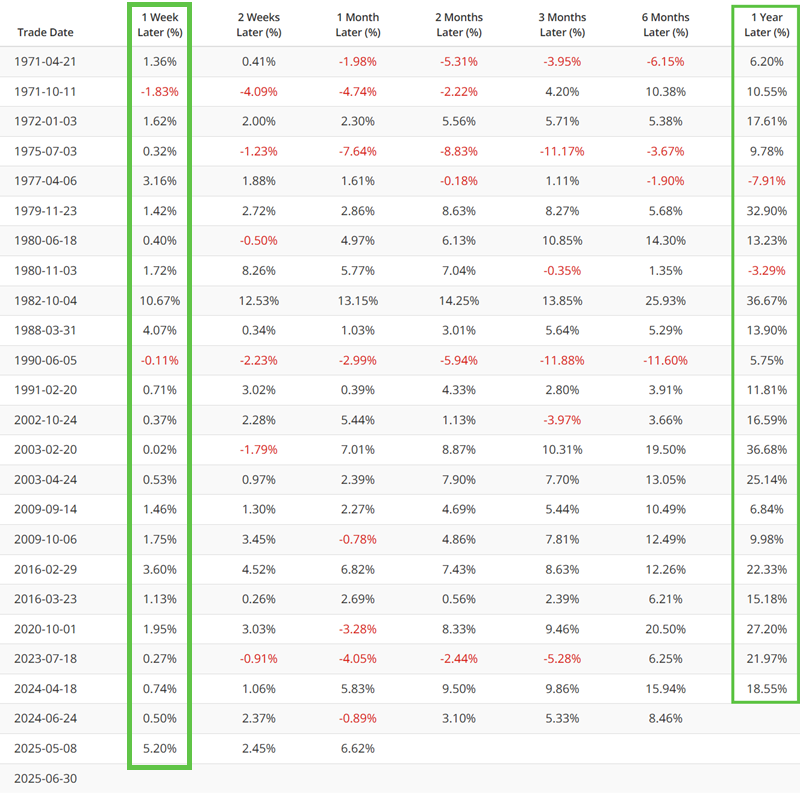
The table below summarizes Nasdaq 100 performance following the dates highlighted above.
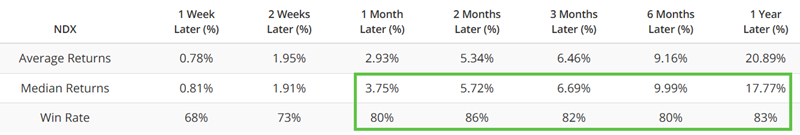
The key point in the table above is the 80%+ Win Rate for 1 Month to 1 Year. This suggests good reliability as a weight of the evidence indicator.
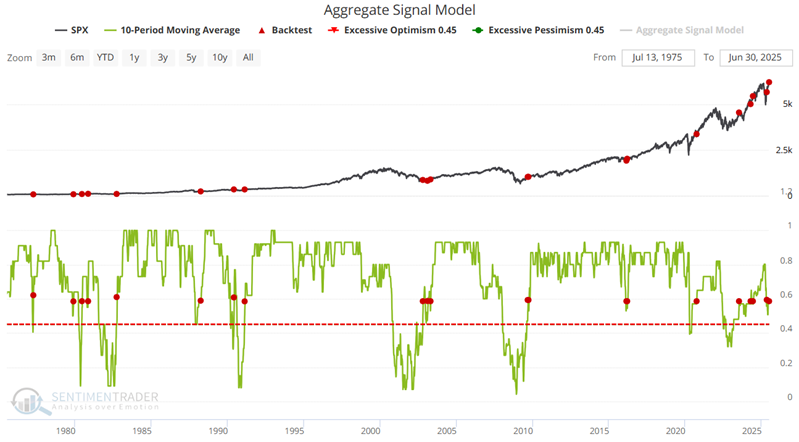
The Aggregate Signal Model re-establishes a favorable level
As the name implies, our Aggregate Signal Model is based on all our buy/sell signals.
The chart below highlights those dates when the 10-day average of the Aggregate Signal Model crossed above 0.58. This action implies that the model experienced a period of some degree of weakness (i.e., the 10-day average of the model had dropped below 0.58 and has now reversed back above that level, implying renewed indicator strength following a period of weakness).
The table below summarizes subsequent S&P 500 index action. This signal has potential value for short-term traders (a 1-week Win Rate of 92%) and longer-term investors (a 1-year Win Rate of 91% and a Median Return of 14.54%).
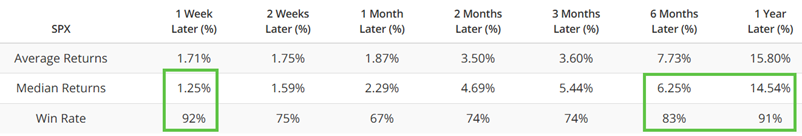
The table below displays signal-by-signal results for the S&P 500.
Remember that saving an indicator to "Favorites" allows for easy review
Remember that you can save signals like the ones highlighted above to your "Favorites." This will enable you to be alerted when a new signal occurs.
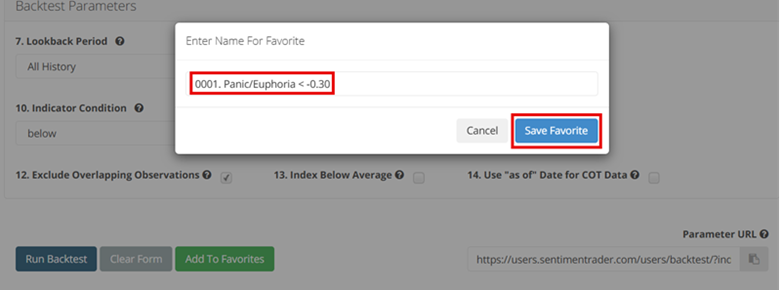
Want to save a particular indicator signal to find out automatically when it generates a new signal? After you run your test in Backtest Engine 1.0, click "Save to Favorites" at the bottom of the output screen.
On the next screen, give the indicator signal a name (you might also add a number, but it is not required) and then click "Save Favorite." That's it.
Want to know if any of your saved Favorites have flashed a recent signal? From the main menu, select "Tools", then "Backtest Engine v1.0."
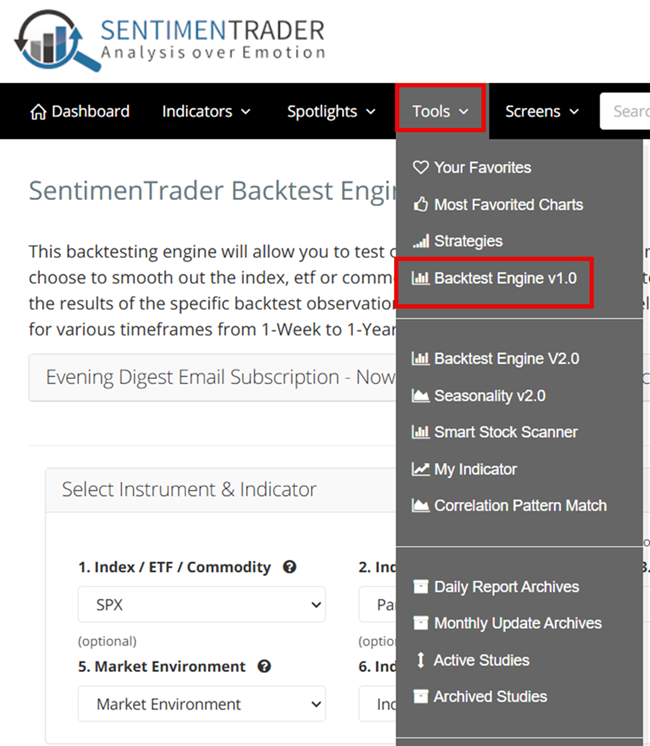
When the "SentimenTrader Backtest Engine" screen appears, scroll down to "Favorites" and click "Find Last Signal." The software will then run through your Saved Favorites and display all recent signals. Doing this daily or weekly lets you keep apprised of new signals from your favorite indicators.
What the research tells us…
Continuation signals can be beneficial, both practically and psychologically. From a practical perspective, they can highlight opportunities to put new cash to work in the market (in anticipation of a resumption of an uptrend). From a psychological perspective, they can help an investor ignore the constant flow of negative "news" that surrounds the market, and sows doubt in investors' minds. Remember, objective indicator signals are not always correct, but they are far more helpful than "gut" feelings based on "news."