Products
SentimenTrader Trading Tools
‍
Backtest Engine
My Trading Toolkit
Correlation Analysis
Seasonality
Indicators & Data API
‍
Proprietary Indicators & Charts
Market Data API
Strategies & Scanner
‍
50+ Trading Strategies
Smart Stock Scanner
Research Reports
‍
Research Solutions
Reports Library
Free Resources
Simple Backtest Calculator
Simple Seasonality Calculator
The Kelly Criterion Calculator
Sentiment Geo Map
Public Research Reports
Pricing
Company
About
In the News
Testimonials
Client Success Stories
Contact
Log inLoginSign up
< BACK TO ALL REPORTS

Two Indicators Flashing Favorable Signs for Stocks - Part I

Jay Kaeppel
2021-10-07
The ratio of Gamma Exposure as a percentage of Market Cap is an indicator that few traders know about - and even fewer understand. But when it behaves in a certain way, it can give helpful clues about the likely direction for stocks. In Part I, we highlight the details.

This is Part I of a two-part series highlighting a pair of little-known indicators that recently flashed favorable signals for the stock market.

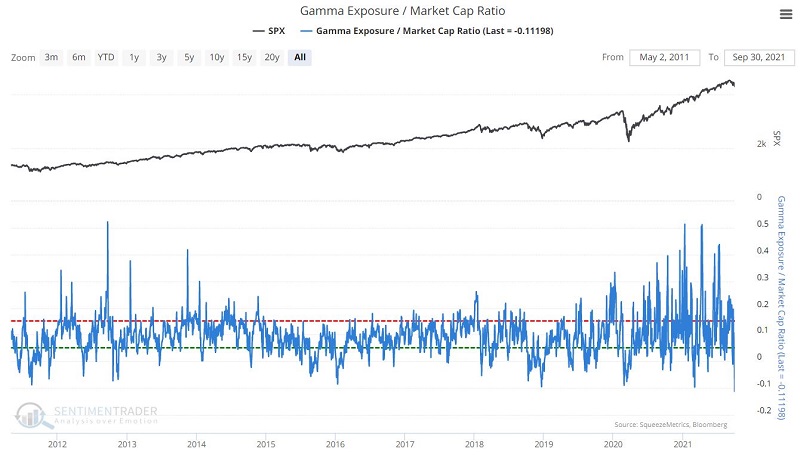
Indicator #1: Gamma Exposure / Market Cap Ratio

Gamma exposure refers to the sensitivity of existing options contracts to changes in the underlying price of the S&P 500 (see our Gamma Exposure chart for more details). 

The chart below takes an extra step and shows Gamma Exposure relative to the market capitalization of U.S. stocks. The higher the level, the more potential selling pressure exists. This value is displayed in thousandths of a percent.

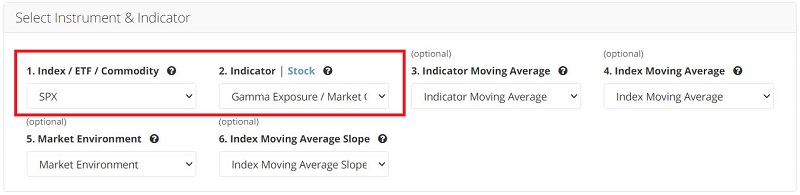
Let's highlight the performance for the S&P 500 Index following all days when:

  • The value for this indicator first rises above 0

You can run this test by clicking here. The input screen appears below.

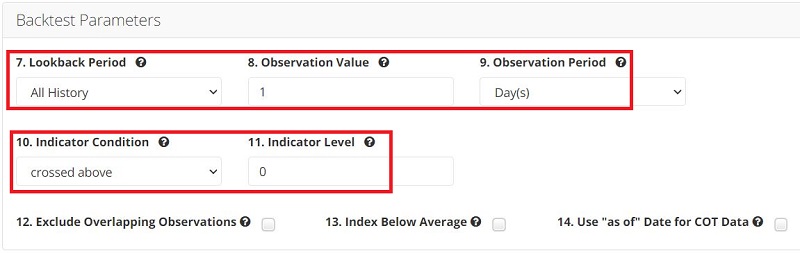
The output screen appears below.

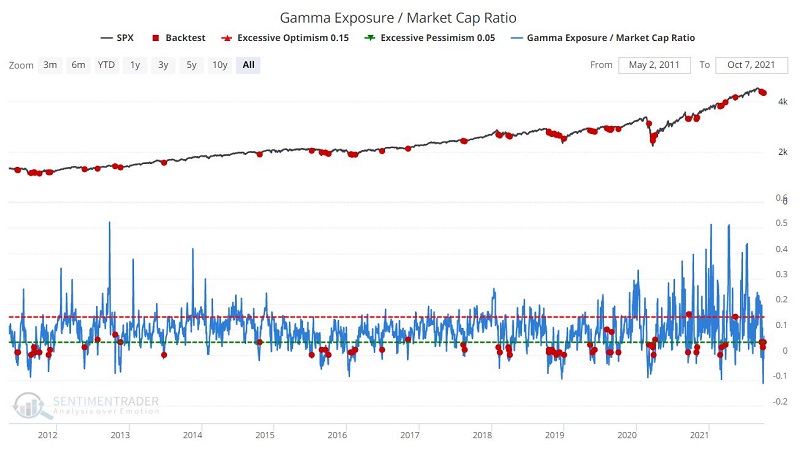
Note that signals often tend to occur in "clusters."

The Summary screen appears below.

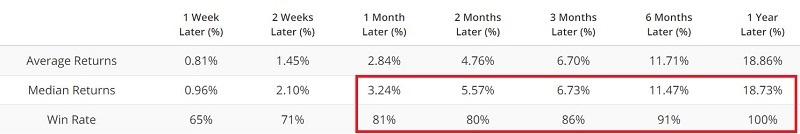
Note the high Win Rates - particularly for 1 Month and out - and the strong Median Returns for all timeframes.

As we see in the screenshot below:

  • The latest signals occurred on 9/22, 10/1, and 10.5

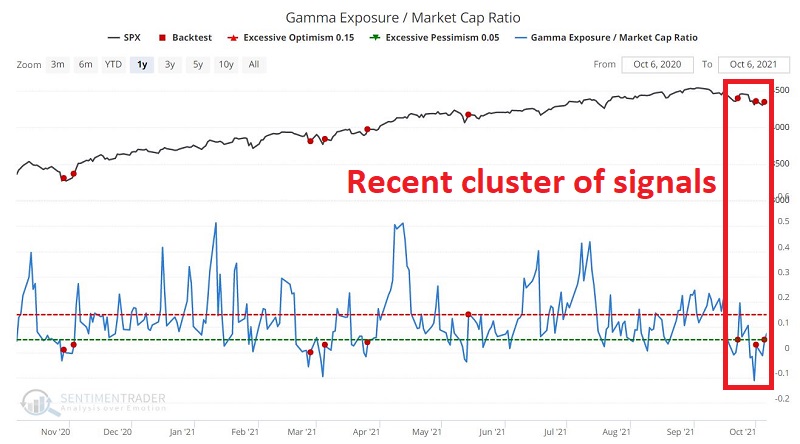
Like most indicators, this one is far from infallible.  Still, the recent cluster of signals - and the high Win Rates dor 1-month to 1-year following precious signals - argues for the potential for renewed market strength as the 4th quarter progresses and possibly beyond.

Stay tuned for Part II.

Sorry, you don't have access to this report

Upgrade your subscription plan to get access
Go to Dasboard
PRODUCTS
SentimenTrader
Trading Tools
Indicators & Data API
‍
Strategies & Scanner
‍
Research Reports
FREE
RESOUrCES
Simple Backtest
Calculator
Simple Seasonality
Calculator
The Kelly Criterion
Calculator
Sentiment Geo Map
‍
Public Research Reports
‍
Pricing
Bundle pricing
‍
Announcements
‍
FAQ
COMPANY
‍
About
‍
In the News
‍
Testimonials
‍
Client Success Stories
CONTACT
‍
General Inquiries
‍
Media Inquiries
‍
Financial Professionals Inquiries
‍
© 2025 Sundial Capital Research Inc. All rights reserved.
Setsail Marketing
TermsPrivacyAffiliate Program
Risk Disclosure: Futures and forex trading contains substantial risk and is not for every investor. An investor could potentially lose all or more than the initial investment. Risk capital is money that can be lost without jeopardizing ones’ financial security or life style. Only risk capital should be used for trading and only those with sufficient risk capital should consider trading. Past performance is not necessarily indicative of future results.

Hypothetical Performance Disclosure: Hypothetical performance results have many inherent limitations, some of which are described below. No representation is being made that any account will or is likely to achieve profits or losses similar to those shown; in fact, there are frequently sharp differences between hypothetical performance results and the actual results subsequently achieved by any particular trading program. One of the limitations of hypothetical performance results is that they are generally prepared with the benefit of hindsight. In addition, hypothetical trading does not involve financial risk, and no hypothetical trading record can completely account for the impact of financial risk of actual trading. for example, the ability to withstand losses or to adhere to a particular trading program in spite of trading losses are material points which can also adversely affect actual trading results. There are numerous other factors related to the markets in general or to the implementation of any specific trading program which cannot be fully accounted for in the preparation of hypothetical performance results and all which can adversely affect trading results.

Testimonial Disclosure: Testimonials appearing on this website may not be representative of other clients or customers and is not a guarantee of future performance or success.