Products
SentimenTrader Trading Tools
‍
Backtest Engine
My Trading Toolkit
Correlation Analysis
Seasonality
Market Prediction
Indicators & Data API
‍
Proprietary Indicators & Charts
Market Data API
Strategies & Scanner
‍
50+ Trading Strategies
Smart Stock Scanner
Smart Option Scanner
Research Reports
‍
Research Solutions
Reports Library
Free Resources
Simple Backtest Calculator
Simple Seasonality Calculator
The Kelly Criterion Calculator
Sentiment Geo Map
Public Research Reports
Education
Sentiment Indicators
Technical Indicators
Pricing
Company
About
In the News
Testimonials
Client Success Stories
Contact
Log inLoginSign up
< BACK TO ALL REPORTS

Two indicators arguing for "buy the dip"

Jay Kaeppel
2024-08-06
Is this a normal pullback, or something worse? It is impossible to know except in hindsight (the endless litany of loud predictions notwithstanding). For what it's worth, two typically reliable weight of the evidence indicators are arguing for "buy the dip."

Key points

  • The percentage of S&P 1500 stocks with a 2-day RSI below 30% spiked during the recent decline
  • The NASDAQ McClellan Oscillator plunged as the Nasdaq 100 declined
  • When these signals have occurred in the past while the underlying index was above a long-term moving average, forward results tended to be above-average

A high % of S&P 1500 Index stocks are showing a low RSI

The chart below highlights previous dates when:

  • The % of S&P 1500 Index stocks with a 2-day RSI below 30% crossed above 70%
  • And the S&P 500 Index was above its 150-day moving average
  • For the first time in three months

The most recent signal occurred on 2024-08-05.

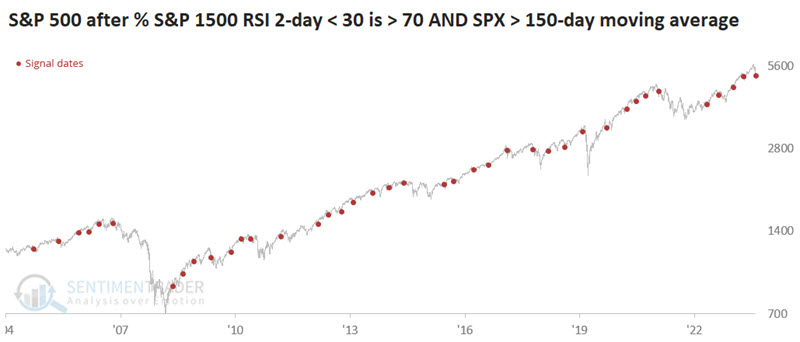
In the chart above, we see that these signals are typically useful in identifying buying opportunities within in an existing uptrend. However, eventually, every uptrend comes to an end, and the last signal (or two) at the end of a trend tends to be followed by declines. So some vigilance in terms of risk management is necessary if trading based on these signals. 

The table below displays subsequent S&P 500 performance.

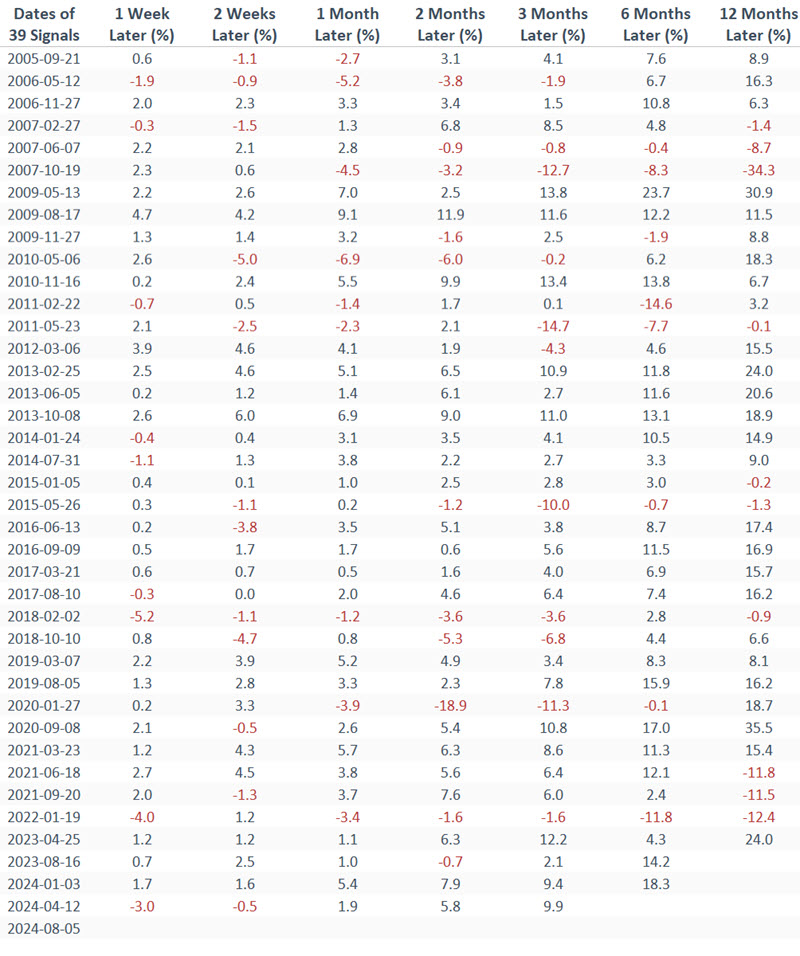
The table below summarizes the S&P 500 performance following previous signals.

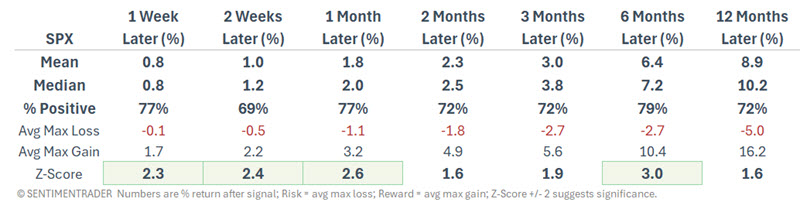
Each instance is accompanied by other factors that can affect stock prices. So, it is not accurate to infer from the results above that there is, say, a 79% probability of higher prices six months from now. This signal should not be considered a "buy signal" but merely as a solid weight of the evidence item that falls on the favorable side of the ledger.

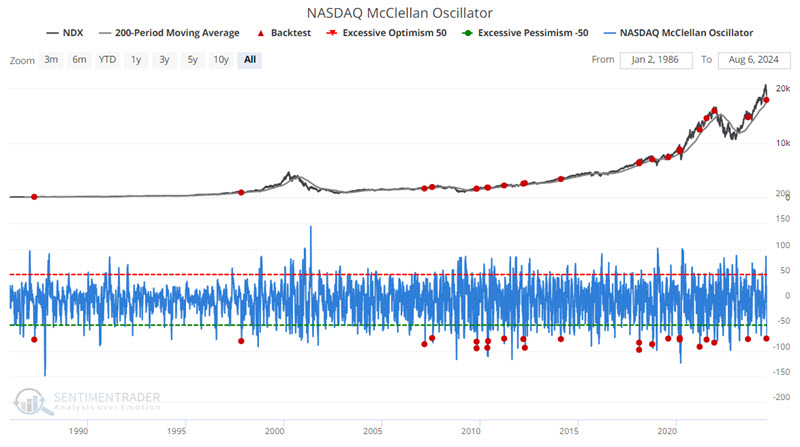
The Nasdaq McClellan Oscillator plunges

The chart below highlights previous dates when:

  • The Nasdaq McClellan Oscillator crossed below -75
  • And the Nasdaq 100 Index was above its 200-day moving average
  • For the first time in three months

The most recent signal occurred on 2024-08-05.

The table below displays subsequent Nasdaq 100 Index performance.

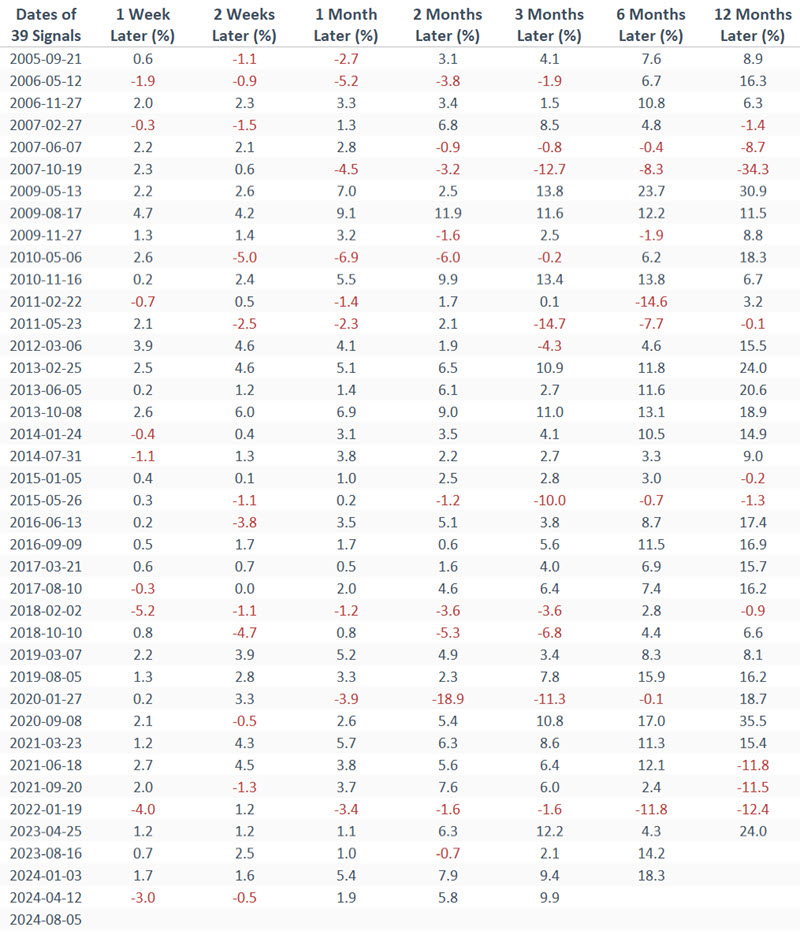
The table below summarizes Nasdaq 100 performance following previous signals.

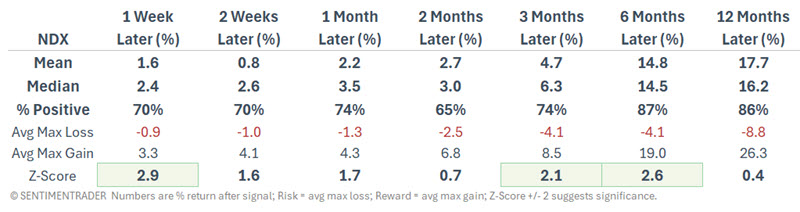
Win Rates are significantly strong across all timeframes, and results have been excellent over three to six months following a signal. However, as with an indicator signal, there are meaningful exceptions to the rule (following the 2021-12-01 signal, NDX lost -11.6% three months later and -18.8% six months later). So, this indicator should not be relied on as a standalone trading model.

What the research tells us…

Pullbacks in an uptrend are normal. The problem is that in real-time, it is often difficult to determine if a given pullback is "normal" or "the start of something bigger." It is unhelpful that every pullback - normal or otherwise - is accompanied by a cacophony of gloom, doom, and dire predictions in the financial press and social media. The purpose of using indicators and models is to help us to ignore the "noise" and focus on the probabilities. With the caveat that the two indicators above are far from perfect in generating signals, they presently suggest that the current pullback is normal and that the historical probabilities favor a rebound in the months ahead. 

PRODUCTS
SentimenTrader
Trading Tools
Indicators & Data API
‍
Strategies & Scanner
‍
Research Reports
FREE
RESOUrCES
Simple Backtest
Calculator
Simple Seasonality
Calculator
The Kelly Criterion
Calculator
Sentiment Geo Map
‍
Public Research Reports
‍
Education
Sentiment Indicators
‍
Technical Indicators
‍
Pricing
Bundle pricing
‍
FAQ
‍
Announcements
‍
COMPANY
‍
About
‍
In the News
‍
Testimonials
‍
Client Success Stories
CONTACT
‍
General Inquiries
‍
Media Inquiries
‍
Financial Professionals Inquiries
‍
© 2026 Sundial Capital Research Inc. All rights reserved.
Setsail Marketing
TermsPrivacyAffiliate Program
Risk Disclosure: The information and tools provided are for research and analytical purposes only and are not intended as investment advice. Market analysis involves uncertainty, and outcomes may differ from expectations. Users should conduct their own due diligence and consider their individual circumstances before making any financial decisions. Past performance is not necessarily indicative of future results.

Hypothetical Performance Disclosure: Hypothetical performance results have many inherent limitations, some of which are described below. No representation is being made that any account will or is likely to achieve profits or losses similar to those shown; in fact, there are frequently sharp differences between hypothetical performance results and the actual results subsequently achieved by any particular trading program. One of the limitations of hypothetical performance results is that they are generally prepared with the benefit of hindsight. In addition, hypothetical trading does not involve financial risk, and no hypothetical trading record can completely account for the impact of financial risk of actual trading. for example, the ability to withstand losses or to adhere to a particular trading program in spite of trading losses are material points which can also adversely affect actual trading results. There are numerous other factors related to the markets in general or to the implementation of any specific trading program which cannot be fully accounted for in the preparation of hypothetical performance results and all which can adversely affect trading results.

Testimonial Disclosure: Testimonials appearing on this website may not be representative of other clients or customers and is not a guarantee of future performance or success.