
Two good things and one bad for SPY

Key points
- Investors are moving back to a risk-on position, which typically begets more aggressive buying
- A rare oversold continuation signal recently flashed a favorable signal as well
- On the flip side, Bond Risk Levels are flashing a yellow light for stocks
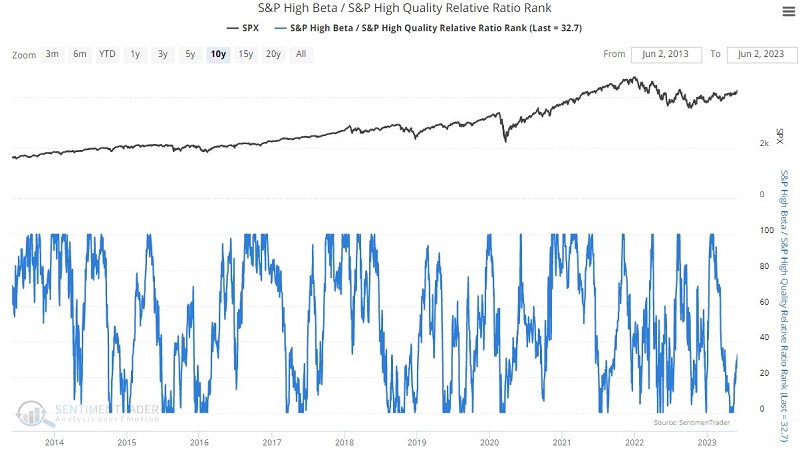
The S&P High Beta / S&P High-Quality Relative Ratio Rank Indicator
The chart below displays the S&P High Beta / S&P High-Quality Relative Ratio Rank indicator over the past 10 years.
According to our site:
This chart shows where the ratio is relative to its range over the past four months. When the relative ratio is high, investors are showing risk-on behavior. When the ratio drops to a low level, they exhibit risk-off behavior.
This indicator compares the performance of statistically volatile stocks (i.e., riskier, more speculative names) to that of more stable "quality" names. Ostensibly, when investors become aggressive buyers, this ratio will rise to a high level, and when investors are being defensive, this ratio will decline to a low level.
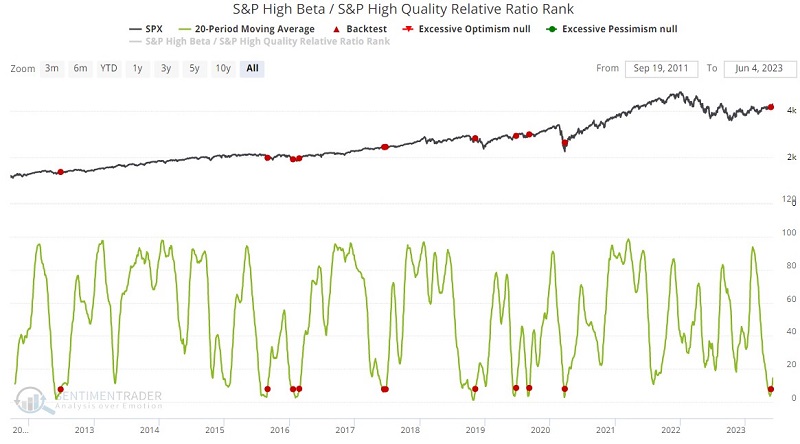
One way to use this information is to identify periods when this ratio reverses upwards from a low level. In other words, we wait for a period of "risk off" behavior to run its course and then reverse back to the upside. The hope is that the upside reversal off of a low level will signal a reversal in the overall market. How does this work in practice? Peruse the information below and decide for yourself.
An upside reversal from a low level is a favorable sign
The chart below displays those times when the 20-day average for the S&P High Beta / S&P High-Quality Relative Ratio Rank indicator crossed above 7.5. In other words, the 20-day average first fell to a very low level (below 7.5) and then reversed back above it (suggesting a favorable turn in investor behavior).
The table below summarizes S&P 500 Index performance following previous signals.
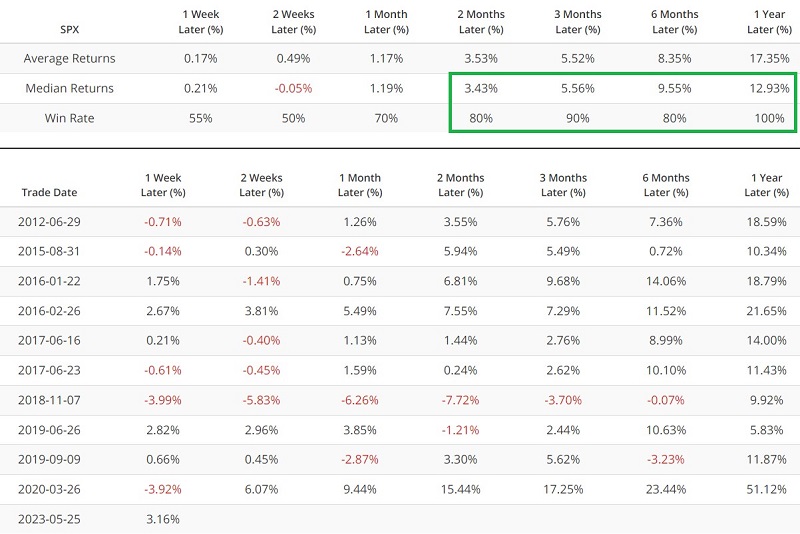
The most notable item is the relatively high Win Rates for two to 12 months after a signal. The most recent signal occurred on 2023-05-25. One caveat is that the indicator has a relatively short history.
SPY New High % Indicator flashes an unusual - but typically effective - signal
As the name implies, the SPY New High % Indicator shows the percentage of stocks in the SPDR S&P 500 ETF Trust ETF (ticker SPY) currently trading at a new 52-week high. In a perfect world, we would like to see high values to suggest strong bullish participation. However, as with the indicator above, there is more than one way to interpret indicator action.
This test will examine SPY performance after this indicator hits 0% while SPY is already in an objectively defined uptrend. This combination often highlights a short-term oversold condition in an uptrend, creating a buying opportunity for longer-term investors.
Specifically, this test will highlight days when the SPY New High % equals 0 while the closing price for SPY is above its 150-day moving average. The chart below highlights those days with a red dot, and the table summarizes subsequent SPY performance.
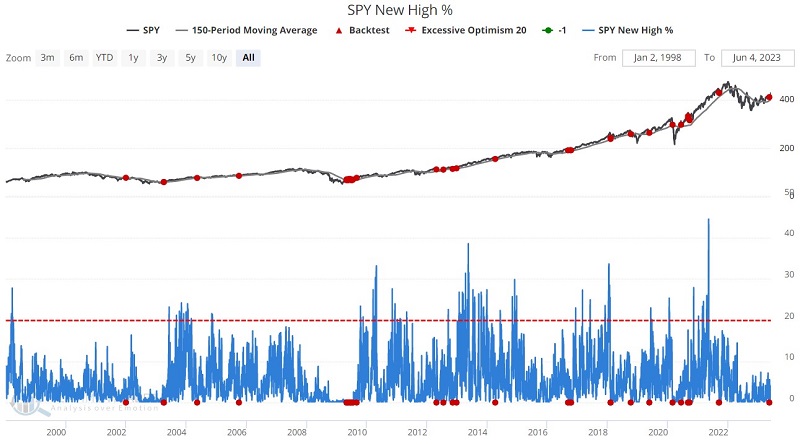
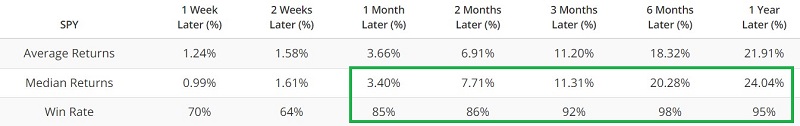
The most recent signal occurred on 2023-05-24.
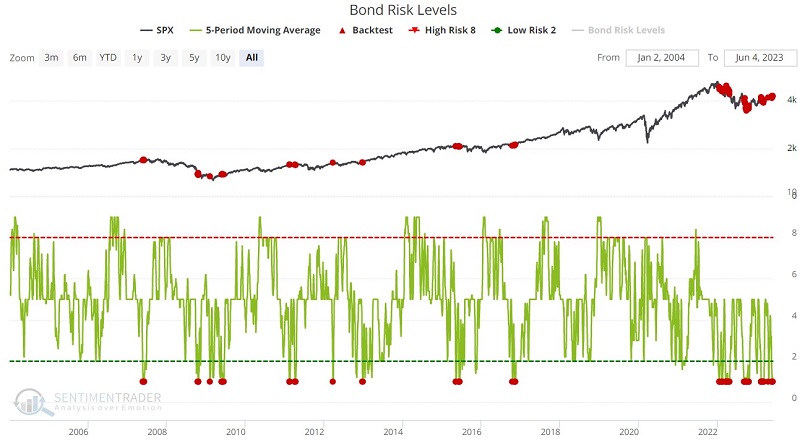
Bond Risk Levels remain a potential fly in the ointment
As long as we are looking at unique ways to interpret indicators, let's look at one presently on the unfavorable side of the ledger. Both stock and bond price movements are heavily influenced by changes in interest rates. As it turns out, when our Bond Risk Levels indicator reaches a low level, the stock market tends to underperform its long-term average significantly.
This test will highlight days when the 5-day average for our Bond Risk Levels indicator equals 1. The chart below highlights those days with a red dot, and the table summarizes subsequent S&P 500 performance.
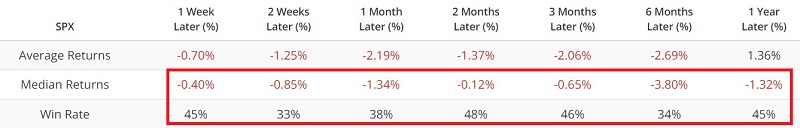
As you can see in the table above, Median Returns are negative across the board, and Win Rates are far below historical averages.
What the research tells us…
As we have seen since the middle to late stages of 2022, various indicators continue to add weight to the bullish side of the ledger for stocks. The S&P High Beta / S&P High-Quality Relative Ratio Rank and the SPY New High % indicators are the latest additions and suggest that the rally that began last October may still have room to run. At the same time, the recent reading from the Bond Risk Levels indicator reminds investors of the following:
Jay's Trading Maxim #18: Follow the trend, but DO NOT fall in love with the trend.
The current trend appears bullish, but investors are encouraged to manage risk ruthlessly.