
Two good reasons to monitor the healthcare sector closely in January

Key points
- Despite weakness in the overall market so far in 2024, the healthcare sector has been moving higher
- A strong January for this sector typically portends good things for the rest of the year
- Healthcare sector corporate insiders have remained surprisingly patient despite lackluster results in recent years - this too, could portend good things
The January Barometer… for Healthcare
As January goes, so goes… healthcare? Said possibly no one ever. But as you can see in the chart below, despite the tough start to 2024 for the broader market, the Health Care Select Sector SPDR Fund ETF (ticker XLV) is up +2.9% in the first six trading days of the year.
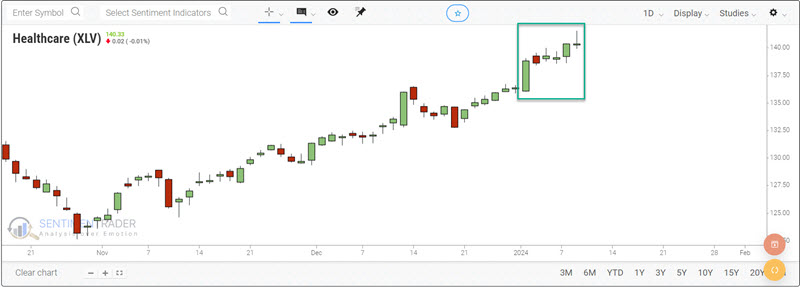
Does this matter? History suggests that if the healthcare sector can hold on and close the month of January with a gain, it bodes very well for the sector for the rest of the year.
Our test will use the FAMA French Index for health care from 1944-12-31 into 1991 and the S&P 500 Health Care Index to the present. We will first look at the performance of the healthcare sector from the end of January through the end of December only if the healthcare sector has shown a gain for January since 1945.
The chart below displays (on a logarithmic scale) the growth of $1 invested in the healthcare sector for the last 11 months of the year if the sector showed a gain during January. The initial $1 grew to $1,026.
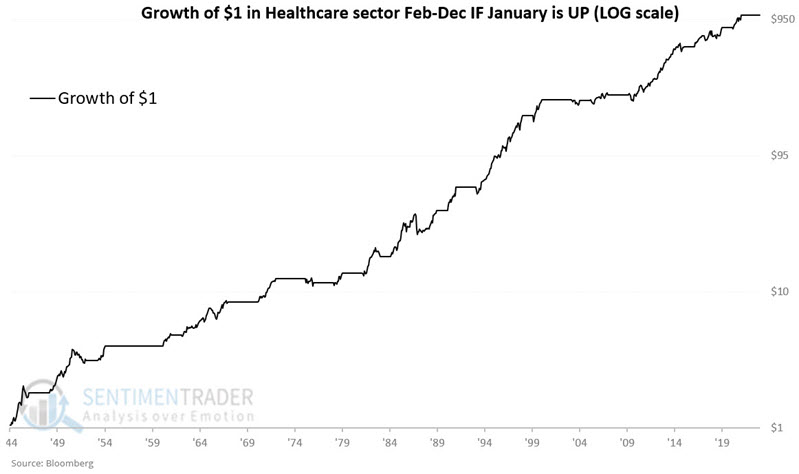
The table below summarizes the healthcare sector performance from February through December if January showed a gain.
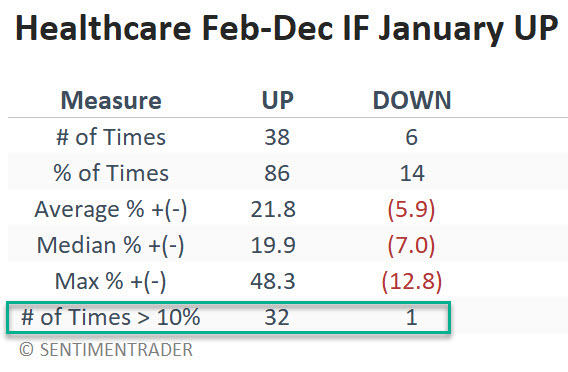
As always in the markets, nothing is a sure thing. During six of the 44 years when healthcare showed a gain during January, we have witnessed a decline the rest of the year. This includes an 11-month loss of -12.8% in 1952, -7.5% in 1987 and -7.4% in 1966. Nevertheless, the Win Rate and Average and Median results skew heavily to the positive side. Probably the most compelling result is that 32 of the 38 years witnessed a gain of +10% or more, versus just one year with a decline of greater than -10%.
The "other" years
For the sake of comparison, the chart below displays the growth of $1 invested in the healthcare sector for the last 11 months of the year if the sector showed a loss during January since 1945.
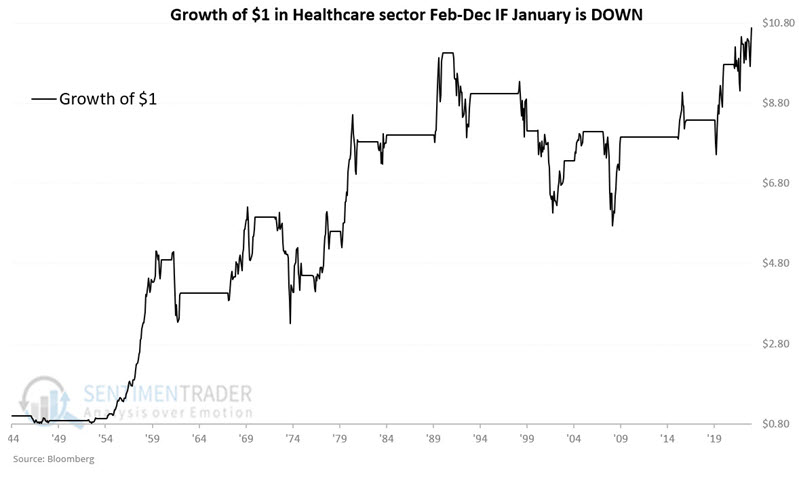
The long-term result is not terrible, as the equity curve works from the lower left to the upper right. Still, a closer look reveals many severe bear market declines and only a minor net gain in the past 30+ years. Likewise, while $1 invested only following up January's grew to $1,026, $1 invested only following down January's grew to just $10.69. The table below summarizes results during "down January" years.
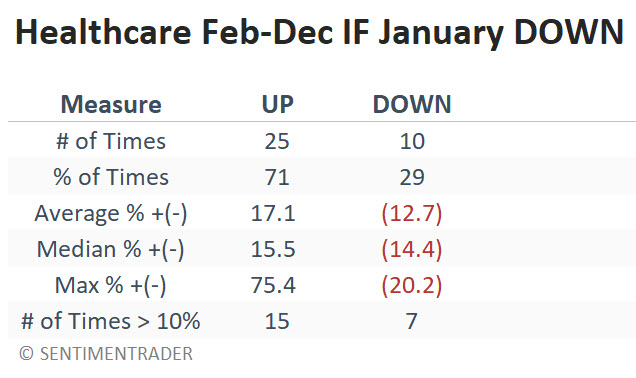
While a down January for healthcare may not necessarily result in a bear market decline, it is also not a compelling reason to buy and hold healthcare stocks in nearly the same way an up January appears to be.
Insider action remains another reason to pay attention
As we saw above, the healthcare sector, generally speaking, has not been a bad place to be, with a much greater long-term propensity for gains than losses. However, the sector has been primarily dead money since topping out in September 2021. Nevertheless, one key group of investors - healthcare corporate insiders - have been sending a clear signal regarding their longer-term outlook for the sector.
The most notable action has been a dearth of selling among corporate insiders. The chart below highlights all weeks when our Corporate Insider Sells - XLV indicator was below 210.
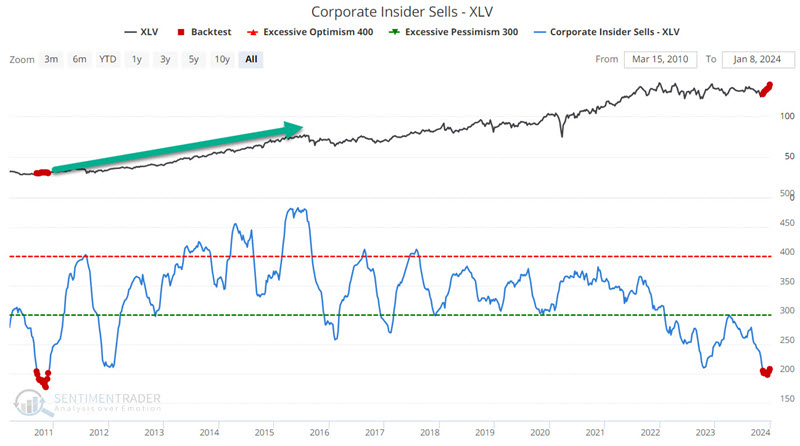
This has only happened in 2010 and since mid-November 2023. A five-year bull market followed the 2010 sellers strike in the healthcare sector.
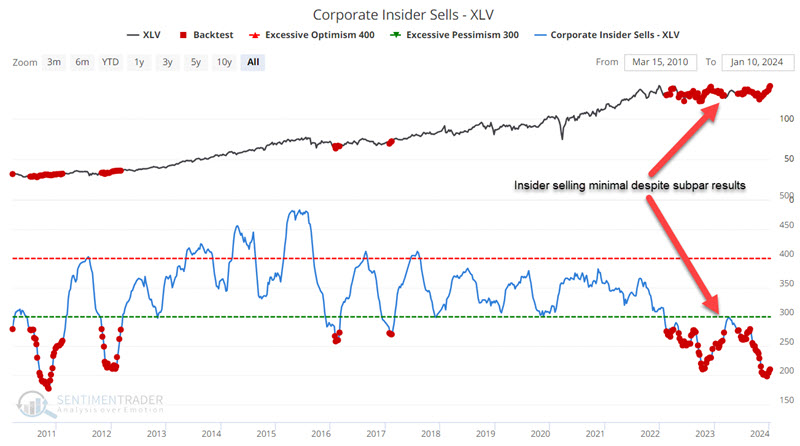
If we use a less restrictive value of 280, we see that healthcare sector insiders have been extremely patient during the dead money period of the last two years. Historically, Corporate Insider Sells - XLV indicator readings below 280 have seen XLV rise 90% over the ensuing year.
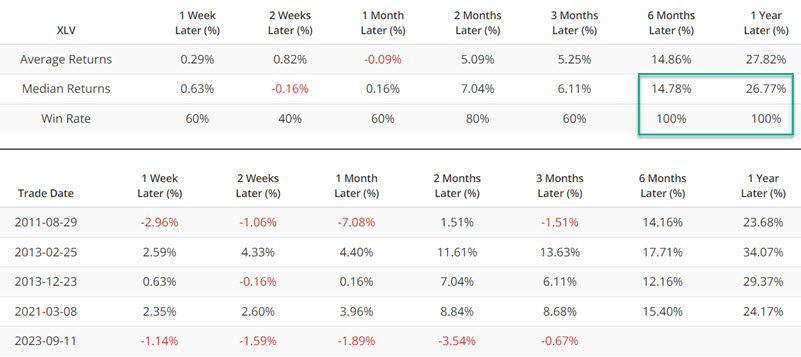
One other insider measure of note was the recent spike in the Corporate Insider Buy/Sell Velocity - XLV indicator. This indicator takes a 4-week rate of change for insider buys and subtracts a 4-week rate of change for insider sales. The more positive the difference, the more that insider are buying their stock and the more positive for the market. The chart and table below highlight XLV performance following spikes in this indicator above 75. The most recent signal occurred on 2023-09-11. XLV subsequently plunged for another month before embarking on its recent rally.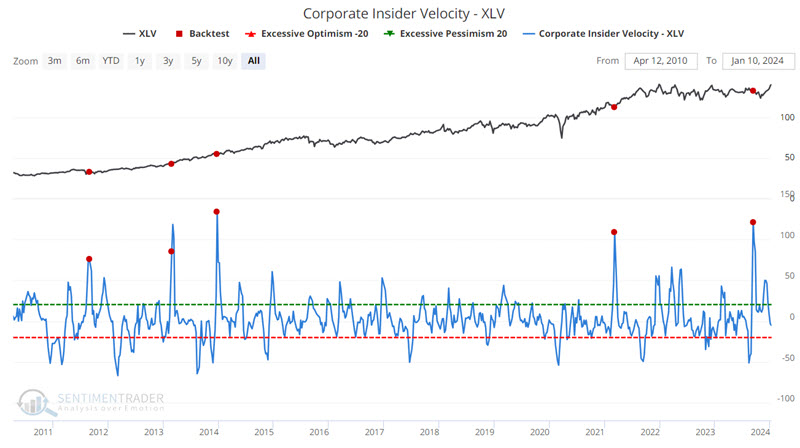
What the research tells us…
After several years of highly subpar results, the healthcare sector is trying to return to a market leadership position. There is no guarantee that the rally since October 2023 will continue to follow through as XLV faces some significant overhead resistance. Still, industry insiders have steadfastly indicated that they are not at all bearish on their industry despite the lackluster results of recent years. With healthcare performing well early in January - and exceptionally well relative to the overall market - it sets up the potential for a positive January Barometer signal for the sector in 2024.
Bottom line: Pay close attention to the healthcare sector between now and January 31st.