
Two for the bulls and two for the bears

Key points
- With the market threatening to break out, it is important to repect the trend and give the bullish case the benefit of the doubt - while also remaining alert to potential signs of danger
- IPO activity and gamma exposure are two less widely followed indicators recently flashing green…
- ...meanwhile, new high and new low action is causing two time-tested warning signs to start flashing yellow
Regarding an objective approach
One of the benefits of writing for Sentimentrader.com is that I am not tasked with selling a bullish OR bearish point of view. My job is not to tell investors and traders what to do or think. My only job is to tell you what I see.
Over the years, I have often seen individuals "make up their minds" and then seek out information to reaffirm their opinions while ignoring information that fails to fit their narrative. This approach is too often counterproductive. A better approach is to include all evidence - whether it agrees with your underlying opinion or not - and weigh all of it as objectively as possible.
At any point in time, there will be some indicators flashing green, others flashing yellow or red, and others still that don't say anything. Our job as investors is to assess all signals as honestly as possible. With the stock market threatening to break out to a new high (and maybe another upleg?), many investors are becoming more entrenched in their thinking. Bulls are ready to launch into "I told you so" mode and bears are still pointing to valuation/interest rates/economic data and saying, "Just wait" to the bulls.
Reviewing previous work, I have mainly written "bullish for stocks" pieces in the last year. That is not because I can "predict" anything (I'm can't). It's simply because the weight of the evidence has fallen mainly on the favorable side of the ledger. If the market wants to keep running higher, I will certainly not object - and certain indicators are confirming a favorable outlook. However, it is worth noting that several indicators that have done a reasonable job of warning of gathering storm clouds in the past are presently also sending messages.
What follows is a look at signals from two indicators flashing green for stocks and two others flashing yellow. The incorrect way to look at these is to pick the two that agree with your own bullish or bearish opinion and dismiss the two that disagree. The correct way to look at these (at least in my opinion) is to give the bullish case the benefit of the doubt but also to make sure you do not fall into the trap of becoming more bullish (or even giddy) if the market moves higher - and also to make sure that you are aware of the "location of the nearest exit."
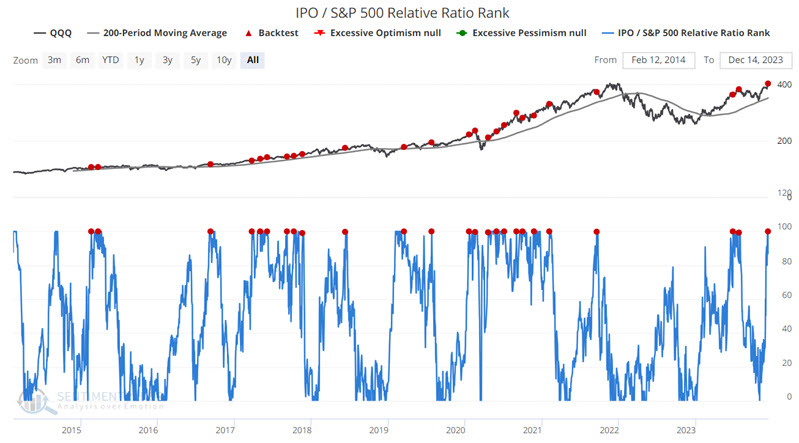
IPO / S&P 500 Relative Ratio spikes
The IPO / S&P 500 Relative Ratio Rank indicator chart shows where the ratio is relative to its range over the past four months. When the relative ratio is high, investors are showing risk-on behavior. When the ratio drops to a low level, they are exhibiting risk-off behavior.
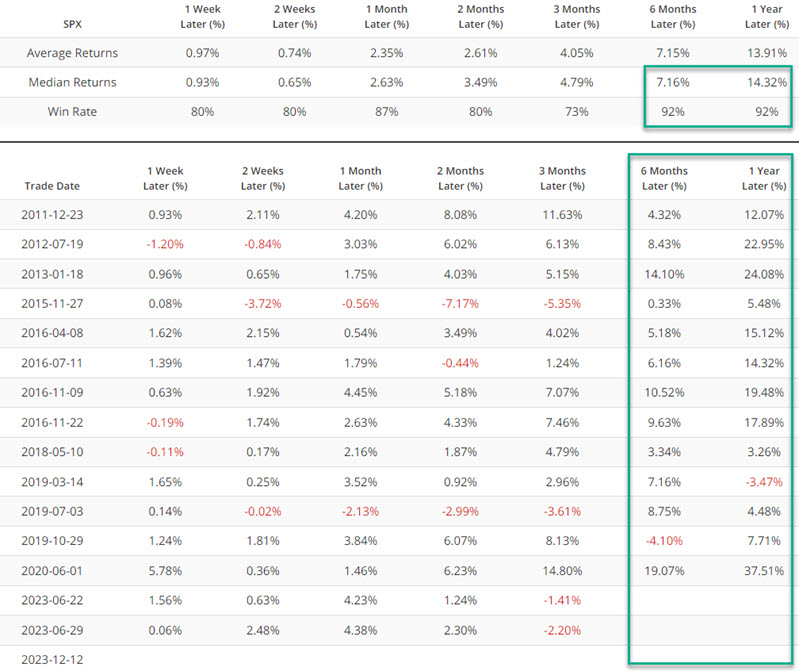
The chart below displays those dates when the indicator crossed above 99% for the first time in a month while the S&P 500 Index was above its 200-day moving average. Generally, this is a "confirmation" or "continuation" of an uptrend type indicator.
The tables below summarize subsequent S&P 500 performance and show signal-by-signal results.
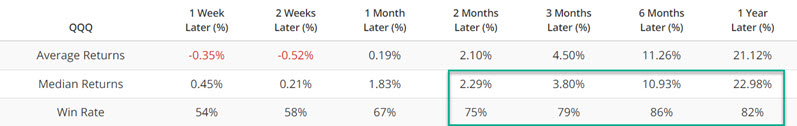
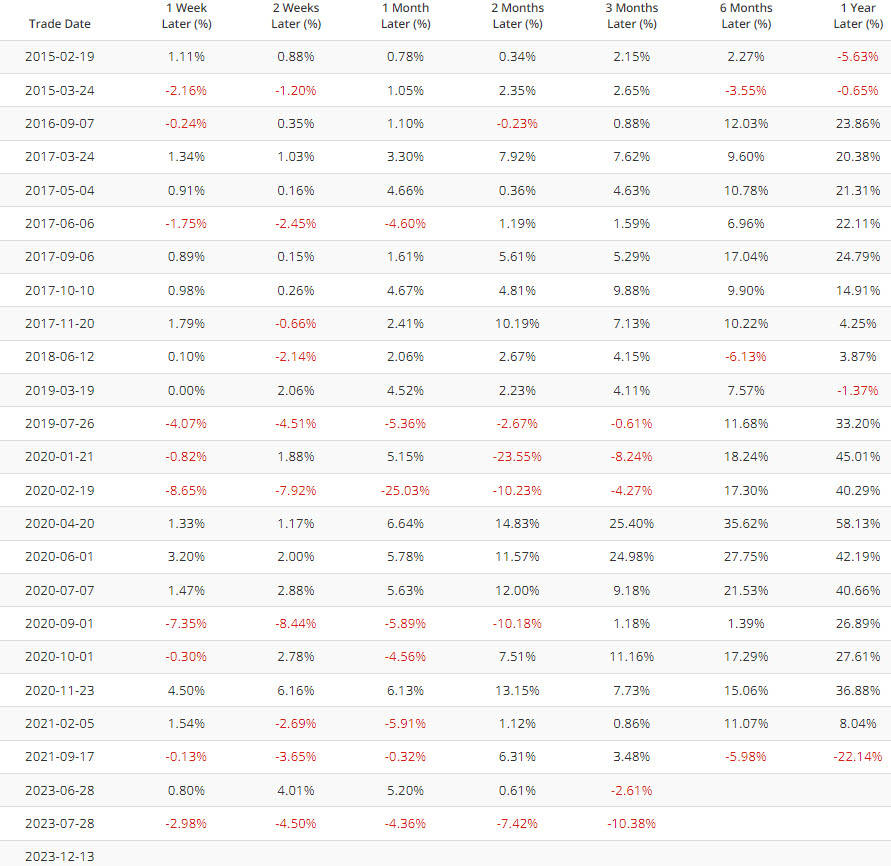
Win Rates are decent, if not spectacularly high. The six- and twelve-month results have been solid, though the 2021-09-17 signal preceded the 2022 bear market.
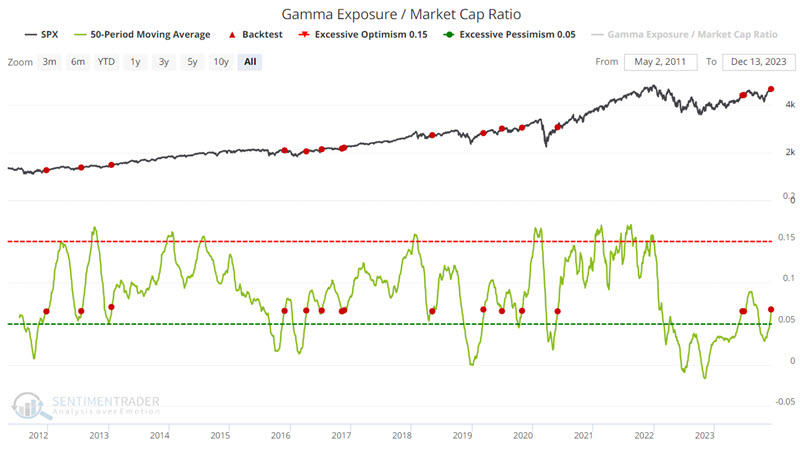
Gamma Exposure / Market Cap Ratio reverses off of a low
Gamma exposure refers to the sensitivity of existing option contracts to changes in the underlying price of the S&P 500. This chart shows Gamma Exposure relative to the market capitalization of U.S. stocks. A reversal off of a low often signals renewed buying pressure.
The chart below highlights those dates when the 50-day indicator average crossed above 0.065.
The table below summarizes subsequent S&P 500 performance and displays signal-by-signal results. Win Rates have been notably high during six and twelve months.
Let's look at two indicators that paint a less rosy picture.
Nasdaq High/Low Logic Index signals churning
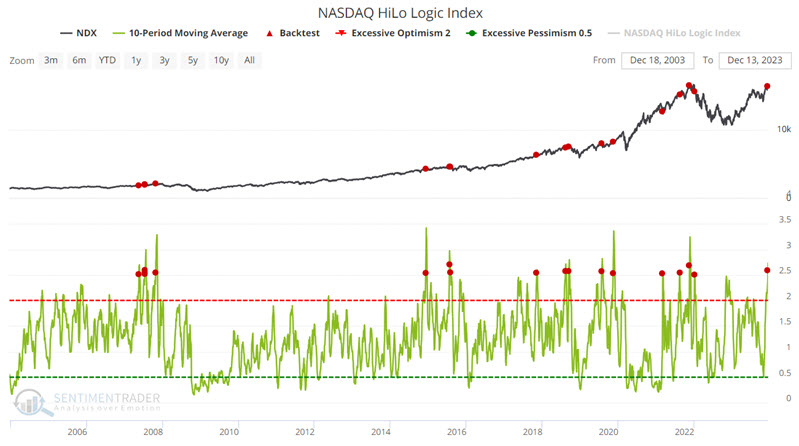
The HiLo Logic Index was created by Norman Fosback in 1979. Intended as a way to observe "split" market conditions, it looks for times when there are both a large number of 52-week highs AND 52-week lows among securities on the exchange. When there are a lot of both, the market is severely split between winners and losers, and it tends to be negative for stocks. When there is a very low number, then the market is heavily one-sided, which tends to be a positive for stocks. The indicator is traditionally interpreted over a longer time frame, so we suggest viewing it with a 10-day moving average.
The chart below highlights those dates when the 10-day average for the Nasdaq High/Low Logic Index crossed above 2.5 in the last 20 years.
The tables below summarize subsequent Nasdaq 100 Index performance and show signal-by-signal results.
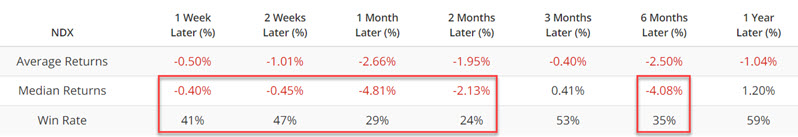
Historical performance is notably poor on average over 1, 2, and 6-month periods. Note also that Win Rates of 24% to 35% suggest a "strong tendency" for weakness but are by no means a sure thing. This juxtaposition with the indicators above suggests the potential for a lot of price volatility in the months ahead.
The NASDAQ Titanic Syndrome has spiked
Bill Omaha created the Titanic Syndrome in the 1960s. It highlights a technical market condition when stocks have recently been at a high, and then there is a sudden jump in new 52-week lows versus highs on the Nasdaq. For our purposes, we use the following conditions: 1) The Nasdaq 100 closed at a 52-week high at some point in the past seven sessions, and 2) New 52-week lows outnumber 52-week highs on the Nasdaq. It is a warning sign that typically precedes trouble over the next 1-3 months.
The chart below highlights all dates when the 150-day average for this indicator was above 0.1.
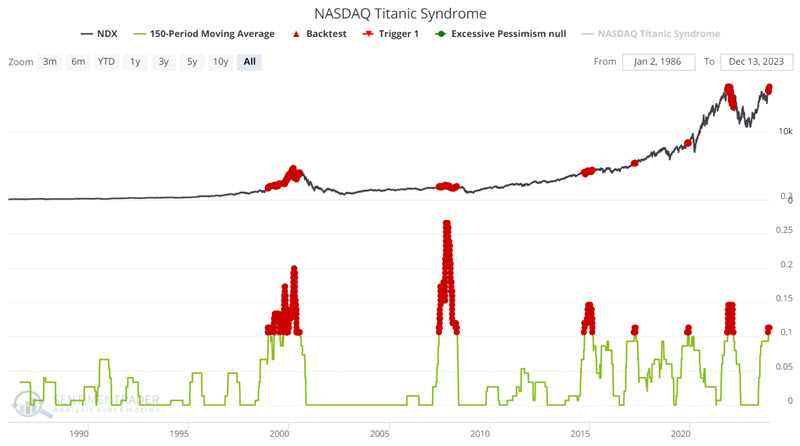
As you can see, sometimes this indicator flashes way too early. Nevertheless, the important thing to note is that except for the signals in 2017, each flurry of red dots was ultimately followed by some notable market weakness.
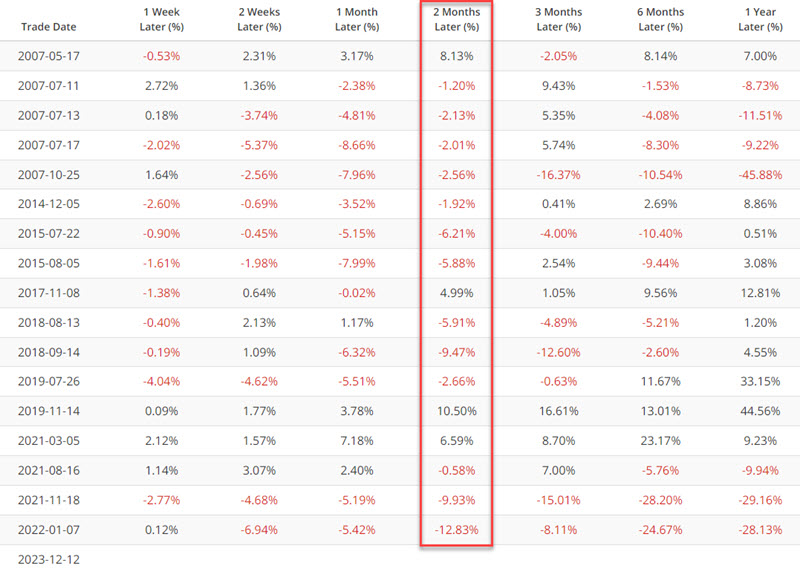
The table below summarizes subsequent NDX performance.
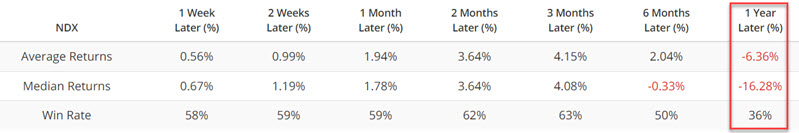
A 36% 12-month Win Rate is far below the historical average. Once again, the message here is not that investors should "sell everything" and hunker down. The real message is to avoid the temptation to become even more ensconced in a bullish mindset if the market does continue to run to higher ground.
What the research tells us…
Risk-on indicators are flashing green. This type of activity can often propel a bullish run to significantly higher ground as more and more investors pile in to avoid being left behind. Riding these trends can be highly profitable. At the same time, the danger for many investors is the age-old human nature foible of becoming more enamored with - and complacent in - an ongoing bullish trend. The second two indicators highlighted above warn us of market volatility and that a potential sharp reversal may lurk somewhere.