
Two favorable signals amid the recent doubt and fear

Key points
- As the stock market digests a streak of 10 out of 11 weeks showing a gain, fear and doubt make an immediate comeback
- Meanwhile, the performance of stock markets around the globe improves under the radar
- Also, equity options traders have turned decidedly bearish in recent weeks - a typically favorable contrary sign
The stock market could churn for a while
The chart below shows that the S&P 500 Index advanced in 10 out of 11 weeks before finally running out of steam when it neared the previous all-time high in January 2022.
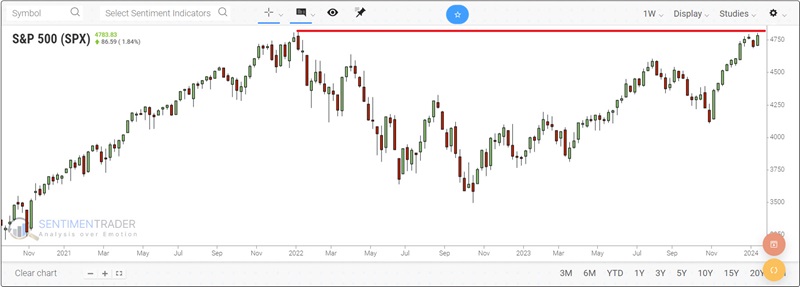
Just as quickly as the market turned down, the chorus of bearish pundits increased in volume - touting a "double top" and all kinds of other bearish prognostications. And as always in the market, there is a chance that they are right. But our goal is not to pick tops and bottoms (because we don't believe anyone can do that consistently). Our goal is to try to assess the current weight of the evidence and to stay with the primary trend until that trend is no longer valid.
The stock market could enter a period of choppy to lower prices. Such action would fit the bill as a normal consolidation after the rip-roaring rally of November and December. Nevertheless, some new and recent developments still argue in favor of the bullish case in the longer term (see here, here, and here). Beyond that, we have noticed a few other reasons to avoid "throwing in the towel" just yet.
Worldwide breadth is improving
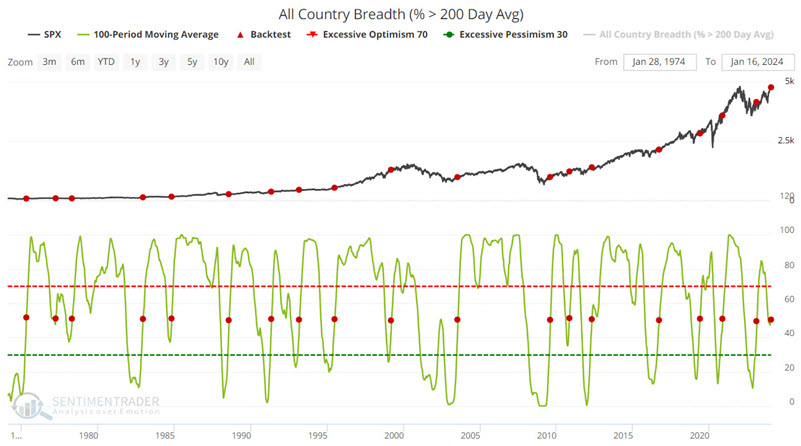
As the name implies, our All-Country Breadth (% > 200 Day Avg) indicator shows the percentage of major country equity indexes (currently numbering more than 20) that are trading above their 200-day moving averages. The chart below shows those dates when the 100-day moving average for this indicator crossed above 51%. The most recent signal occurred on 2024-01-16.
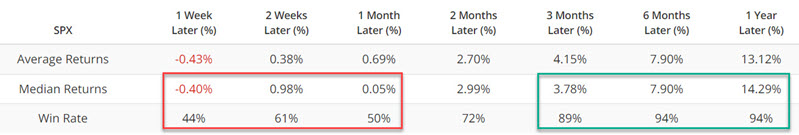
The table below summarizes the subsequent S&P 500 Index performance. Note that immediate performance is hit or miss. But the Win Rate and Median Returns are stellar for 3, 6, and 12 months.
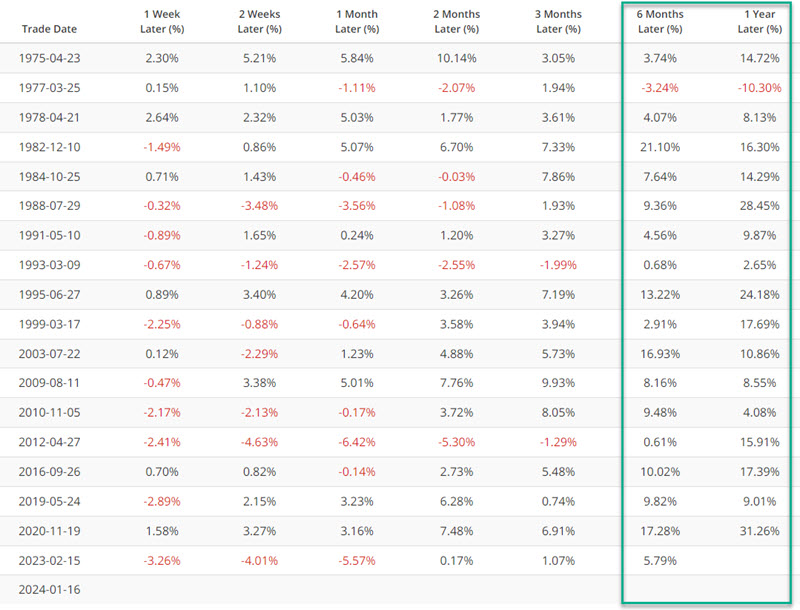
The table below displays results on a signal-by-signal basis. Since the 2023-02-15 signal, the S&P has advanced +14.9% through 2024-01-16.
As always, no signal from any indicator is guaranteed to perform "the next time around." Nevertheless, the latest signal from this indicator falls firmly on the favorable side of the "weight of the evidence" ledger.
Interesting action in the equity-only put/call ratio
The Equity Put/Call Ratio indicator measures the volume of puts traded divided by the volume of calls traded on individual equities on the CBOE (Chicago Board Options Exchange) on a given day. Readings above 1.00 are generally considered favorable for the overall stock market.
The chart below highlights all dates when the Equity Put/Call Ratio crossed above 1.00 while the S&P 500 was above its 200-day moving average.
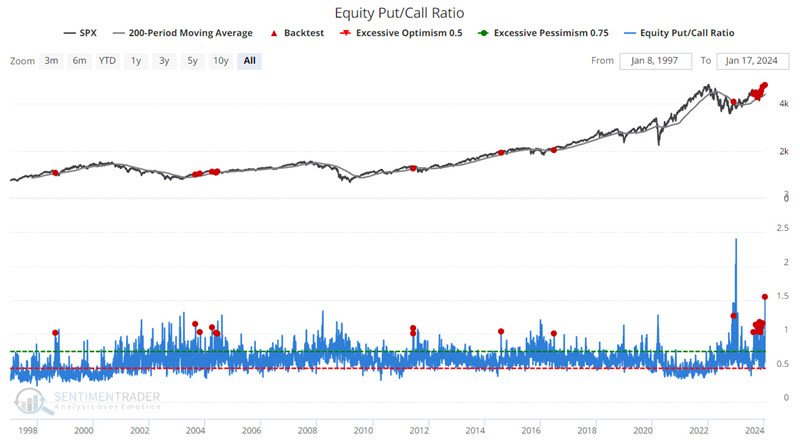
Two things to note are the sporadic nature of this signal and the large cluster of signals in recent months. The table below summarizes the subsequent S&P 500 Index performance.
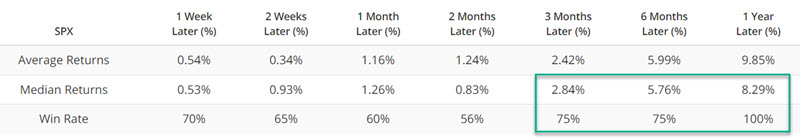
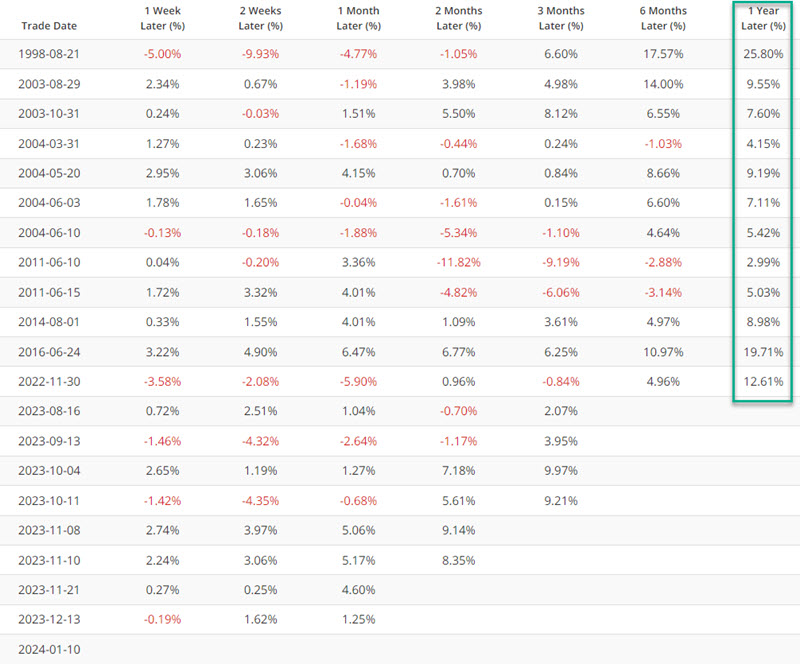
The most interesting thing to note in the table above is the 100% Win Rate 1 Year Later - but also the fact that the 1 Year Median Return is a somewhat mundane +8.29%. This fits well with the "the market may chop short-term but still be favorable in the year ahead" theory. The table below displays results on a signal-by-signal basis.
To put it all into perspective, the chart below displays the hypothetical growth of $1 invested in the S&P 500 Index for one year after each signal date shown in the table above (a new signal that occurs within one year of a previous signal extends the holding period for another year).
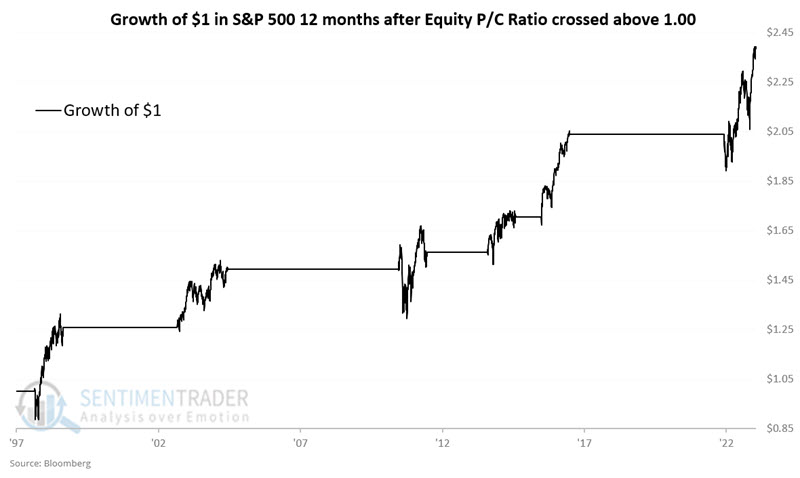
Note that based on the sporadic nature of the signals from this indicator, it is not a good candidate to be used as a standalone trading model. Nevertheless, the "lower-left to upper-right" nature of the equity curve above argues that this indicator can be a valuable tool as part of a "weight of the evidence" approach.
What the research tells us…
While we will continue to hope for an early resumption of the bull market rally and higher new all-time highs, the reality is that the stock market could be in for some "chop" and consolidation. That said, the overall weight of the evidence - including the signals from the two indicators highlighted above - still appears to favor the bullish case.