
Two economic indicators that work better together

Key points
- Any single economic indicator has only a certain amount of utility as it relates to the stock market
- The real value is in combining economic indicators that measure different aspects of the economy to get a broader picture
- Combining Heavy truck sales and housing permits appears to have significant potential utility for stock market investors
Heavy Truck Index ticks back to the upside
The USA Heavy Truck Index tracks the number of heavy trucks newly registered with agencies in the United States. The theory is that rising sales of heavy trucks suggest a willingness on the part of consumers to spend money (as heavy trucks tend to be quite expensive) and vice versa.
To measure the trend, we compare the latest monthly reading for the index to its 26-month exponential moving average, as shown in the chart below.
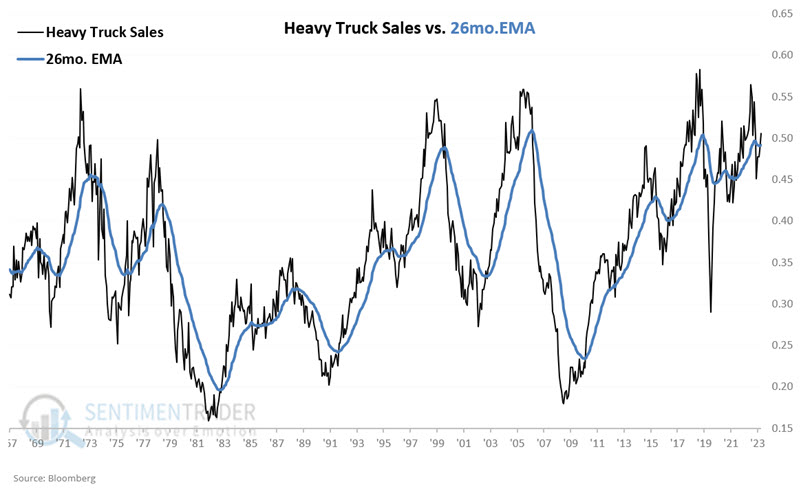
In the chart above, if the black line (Heavy Truck Index) is above the blue line (26-month EMA), the trend is considered favorable for both stocks and the economy. A close look at the chart reveals that the index can gyrate above and below the moving average but also trends strongly at times. The index is back above the moving average as of the latest monthly data. Thus, for our purposes, this indicator is presently rated as "favorable."
Housing Permits also tick back to the upside
The chart below displays the number of housing permits issued in the most recently reported month and an 18-month exponential moving average. Here, too, the implication is that a rising trend is favorable for the economy - and, by extension, the stock market.
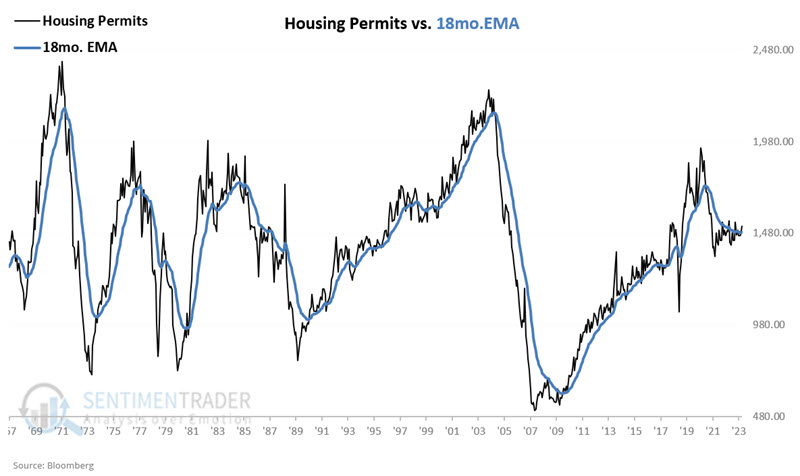
In the chart above, we can see at the far right that the number of permits has jumped above and below the moving average several times in recent months. So, it is impossible to predict if the latest jump back above is the start of a trend or just another random fluctuation.
But in any event, for the moment, we rate this indicator as "favorable."
The value of following these indicators
The indicators above are not considered "trading signals" or "trading systems" per se, i.e., a rise above the moving average does not necessarily constitute an "automatic" buy signal for stocks. Still, there is potential value in following these indices.
The chart below displays the growth of $1 invested in the S&P 500 when the indicators above are "favorable." The black line shows the growth of $1 when the Heavy Truck Index closed the previous month above its 26-month EMA, and the blue line displays the growth of $1 when Housing Permits ended the previous month above its 18-month EMA.
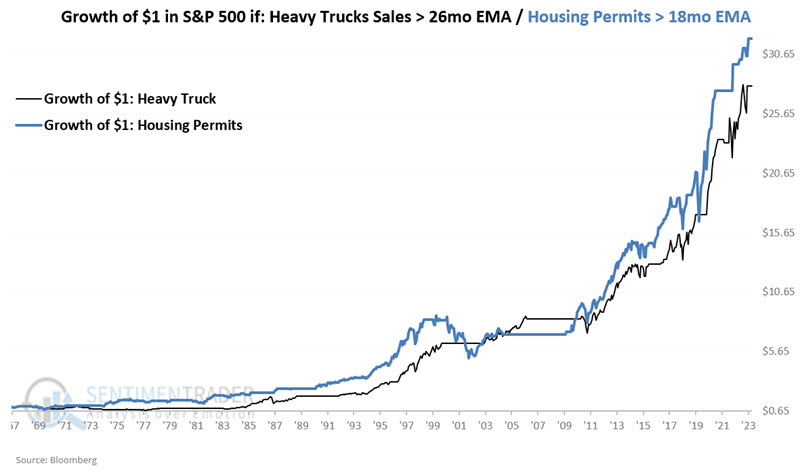
As you can see in the chart above, the stock market has a strong and consistent propensity to rise when these indicators are "favorable."
On the flip side, the chart below displays the growth of $1 invested in the S&P 500 when the indicators above are "unfavorable." The black line shows the growth of $1 when the Heavy Truck Index closed the previous month below its 26-month EMA, and the blue line displays the growth of $1 when Housing Permits ended the previous month below its 18-month EMA.
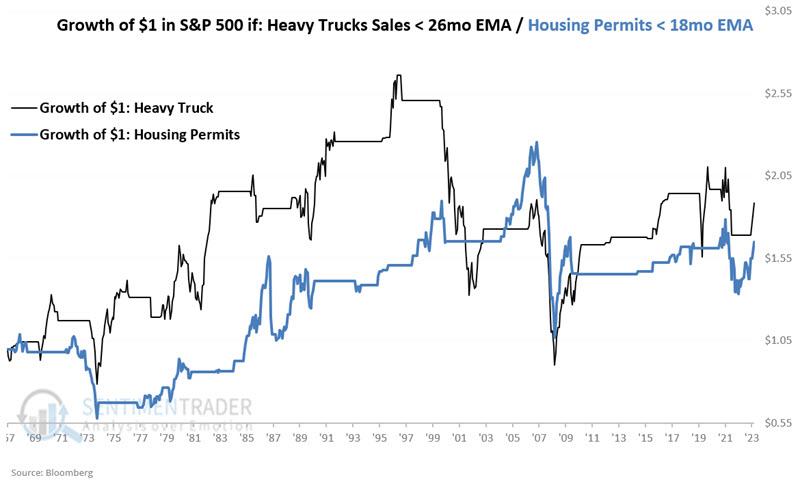
On one hand, we can see in the table below that the S&P 500 performed much better when these indicators were favorable versus unfavorable.
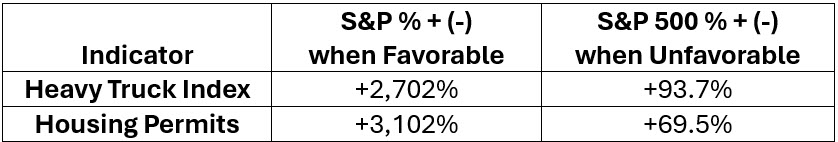
The reason we don't use either of the above indicators as a standalone trading model appears in the chart and table above. While performance was clearly much better when the indicator was favorable, the S&P 500 still managed to show a net gain during the periods when the indicator was unfavorable. Using either of these indicators as a standalone model would have underperformed a simple buy-and-hold approach.
As we said in the Key Points, no single economic indicator foretells the plight of the stock market. Still, what if we considered both of the above indicators in conjunction?
A rudimentary stock market model
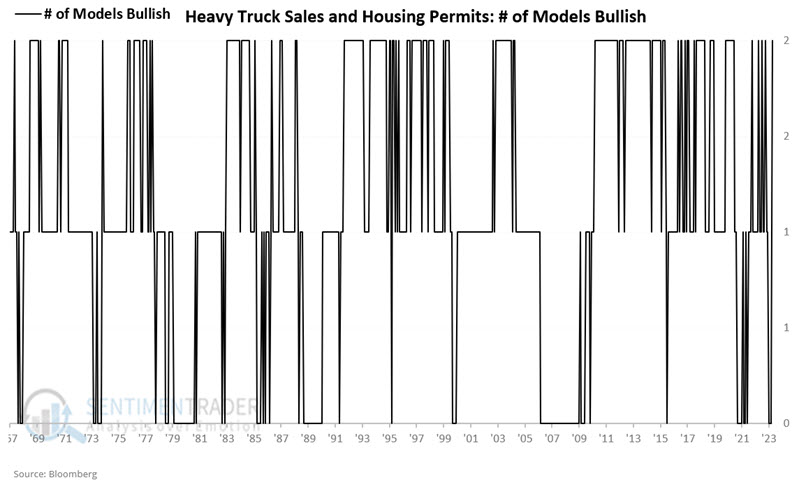
The chart below displays the number of indicators rated as favorable at the end of each month starting in 1967:
- Readings of +1 or +2 are favorable
- Readings of 0 are unfavorable
We will use the Heavy Truck Index and Housing Permit indicators for testing. Our trading rule is simple:
- If EITHER indicator is favorable at the end of the current month, we will hold a long position in the S&P 500 Index the following month; otherwise, we will hold cash
- For this test, no interest is assumed while out of the stock market
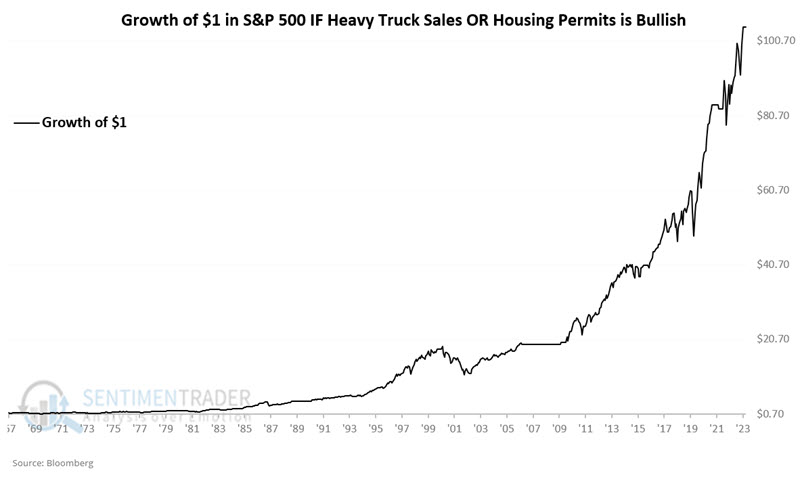
The chart below displays the hypothetical growth of $1 invested in the S&P 500 Index only when at least one of the two indicators is favorable. From 1967 to the present, a hypothetical $1 investment gained +10,354% through 2024-03-22, as shown in the chart below.
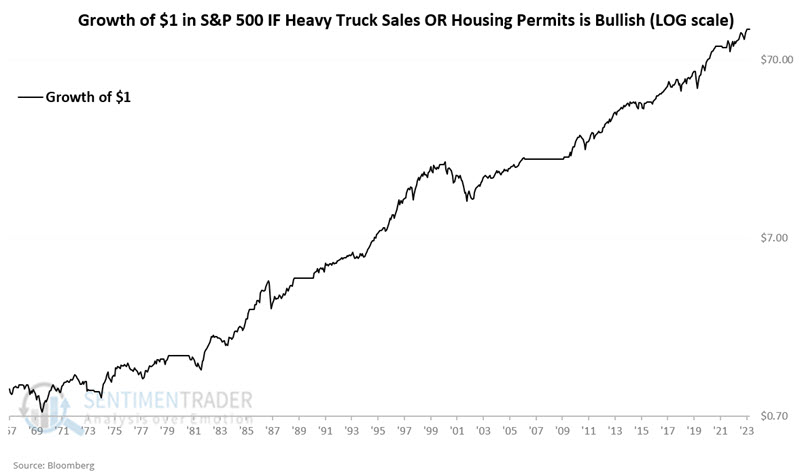
The chart below displays the same results using a logarithmic scale.
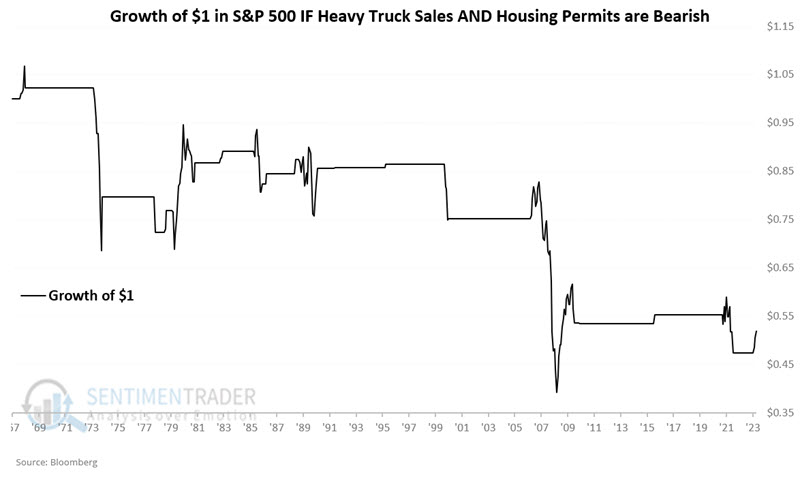
On the flip side, the chart below displays the hypothetical growth of $1 invested in the S&P 500 Index only when BOTH indicators were "unfavorable." Through 2024-03-24, this approach has lost -48% since 1967.
Where we stand
The latest monthly readings for both indicators have popped back above their respective exponential moving averages. This means that as of the end of March, this "model" (such as it is) will be rated as "favorable" for the month of April.
What the research tells us…
The fact that both of the indicators highlighted above will flip to "favorable" at the end of March in no way "guarantees" a continuation of favorable price action. Realistically, both could easily turn down next month, drop below their respective long-term EMAs, and again be rated "unfavorable." Nevertheless, the fact remains that historically, the stock market has performed better when Heavy Truck Sales and/or Housing Permits are in an uptrend than when both are in a downtrend. Does the latest uptick to favorable for both indicators qualify as another "buy signal" for stocks? Not necessarily. But for now, it does appear to fall firmly on the favorable side of the weight of the evidence ledger.