
Two big picture indicators still urging caution

Key Points
- The Goldman Sachs Bear Market Probability Model remains in the nose-bleed territory at 0.81 (suggesting an 81% probability of a bear market in stocks)
- Our own Macro Index Model - which measures the strength of the economy - has plunged in recent months (suggesting a better than 60% probability of an impending recession)
- The difference between these two indicator readings suggests that the potential for a longer, more severe bear market remains intact
Bear Market Probability Index
The Bear Market Probability Index is not a "precision market timing" tool and should not be used as a standalone buy/sell indicator. Instead, it is a "perspective tool" that helps to alert/remind you of potentially high-risk or low-risk situations. The indicator can read from 0 to 1.00, with 0 suggesting a 0% probability of a bear market and 1.00 suggesting a 100% probability of a bear market. Note that this index hit its highest reading ever, 0.87, in March 2021, and remains at an elevated 0.81 reading.
Does this mean a bear market is sure to continue? Not necessarily. To understand what we mean by a "perspective" indicator, let's compare the history of S&P 500 Index performance following readings above 0.70 versus readings below 0.35.
The chart and table below display the history of S&P 500 performance following Bear Market Probability Index readings above 0.70.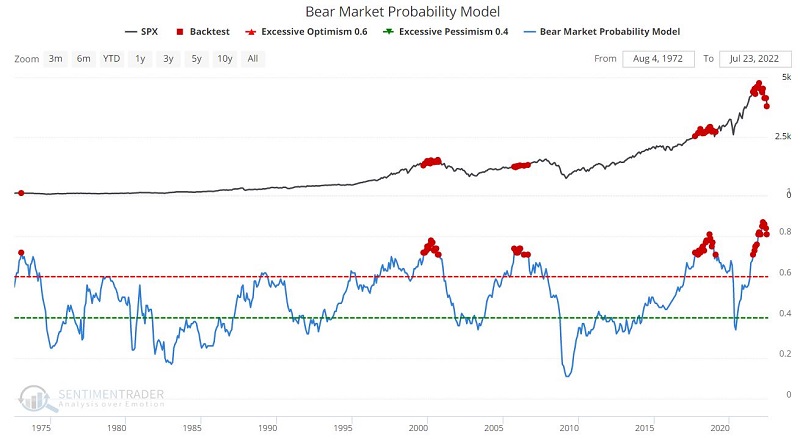
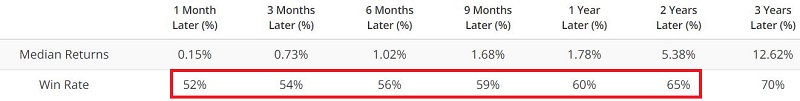
The chart above shows how this index became bearish before most major bear markets. That said, not every reading above 70 was followed by a terrible performance. Nevertheless, the overall results in the table above are very lackluster and well below the historical averages.
On the flip side, the chart and table below display the history of S&P 500 performance following Bear Market Probability Index readings below 0.35.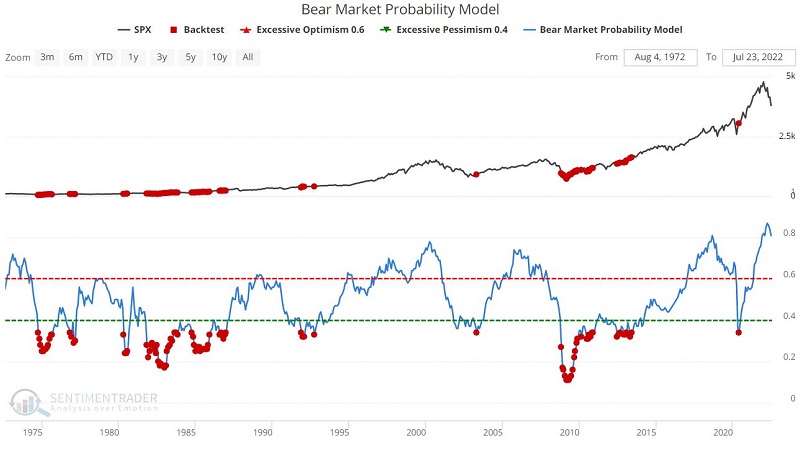
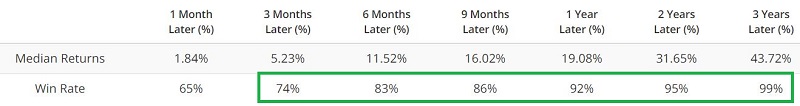
Note the vast improvement in performance numbers here compared to those above.
The bottom line is lower Bear Market Probability values suggest better days ahead, while lower values suggest caution.
Macro Index Model
Our Macro Index Model is designed to measure the strength of economic activity and is not a direct stock market indicator per se. However, because the performance of the economy and the stock market are so tightly intertwined, the Macro Index Model ends up being something of a de facto stock market indicator.
With the Macro Index Model, higher readings are considered favorable, and lower readings are considered unfavorable (which is the opposite of how the Bear Market Probability Index is interpreted). For a more in-depth look at this model, see here.
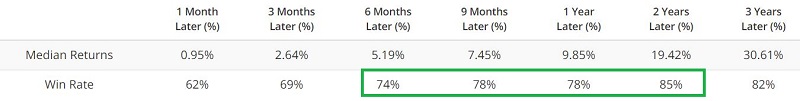
The chart and table below display the history of S&P 500 performance following Macro Index Model readings above 0.70.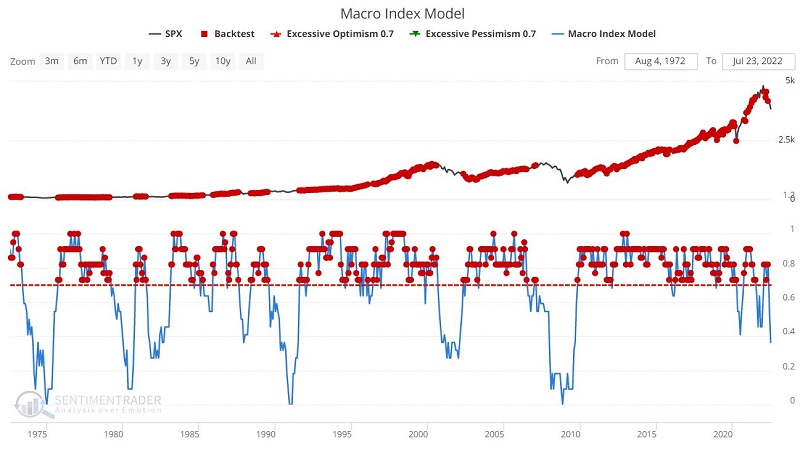
Now let's compare the results above to those when the Macro Index Model is below 0.70.
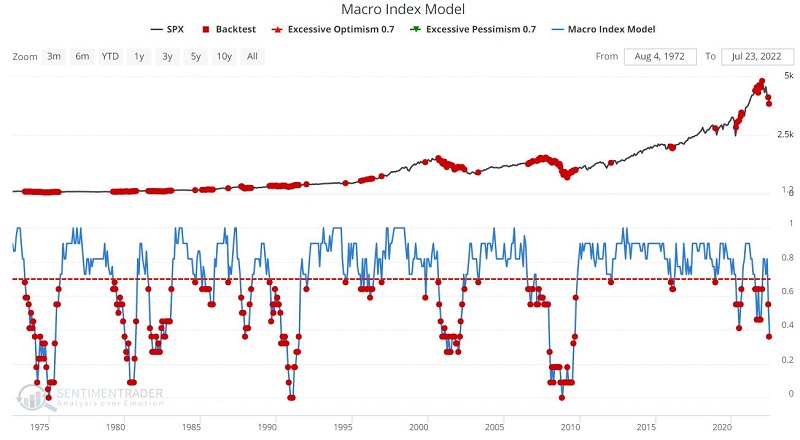
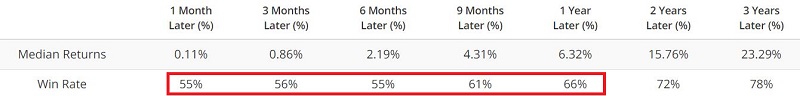
Note that the Win Rates and Median Returns are lower across the board versus those times when the index is above 0.70.
The bottom line: Higher Macro Index Model values suggest better days ahead, and lower values suggest caution (regarding both the economy and the stock market).
Now let's combine these two indicators into one.
Bear Market - Macro Index Spread
Jason originated and revealed this indicator last year. This indicator subtracts the latest Macro Index Model reading from the latest Bear Market Probability Model reading. Interpretation is simple:
- High readings are considered bearish for stocks
- Low readings are considered bullish for stocks
The chart and table below highlight those times when the Bear Market - Macro Index Spread crossed above 28 first time in 6 months.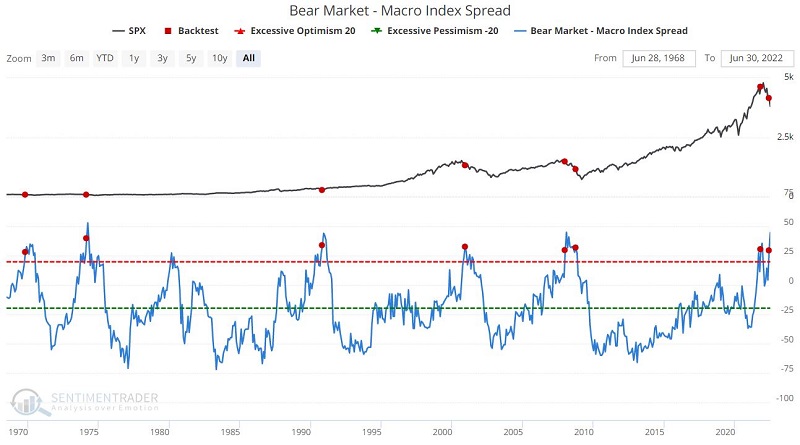
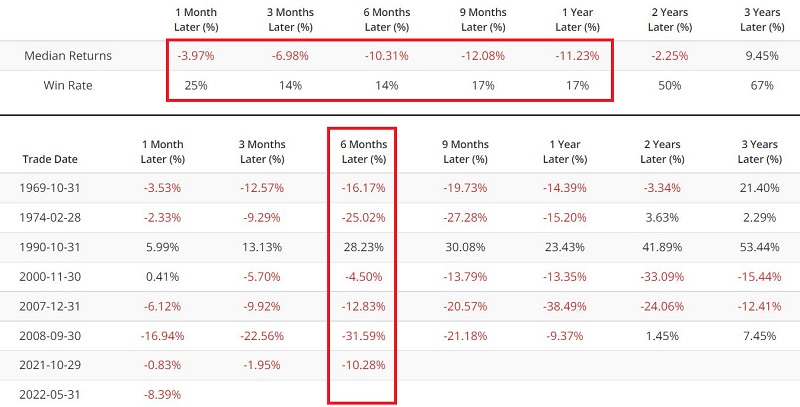
The dreadful performance results speak for themselves. For an alternative method for using this indicator systematically, see this article. The latest warning signals occurred on 10/29/2021 and 5/31/2022.
What the research tells us…
We have seen many overbought/oversold and sentiment indicators flash encouraging signs in the last few weeks and months. In some cases, these indicators have reached levels that have effectively flashed an "all clear" sign in the past. Nevertheless, the current status of the indicators detailed here suggests that investors holding cash wait for more confirmation of a new uptrend before fully committing back to the market.