
Two areas where investors should tread lightly

Key points:
- Almost everyone recognizes that making money in the markets is a function of where you invest
- However, it is also a function of where you don't invest; i.e., how you allocate capital is a key to successful investing
- Two areas I am avoiding at the moment are the Financial sector and the Turkish stock market
- Both are facing serious seasonal headwinds and other unfavorable indicator signals
Seasonality suggests poor odds for Financials
Seasonality is not something that should be relied upon as a sole determining factor in identifying a trading opportunity - or lack thereof. However, it can be an extremely useful filter for telling us "When to look where" for both high- and low-probability opportunities. The chart below shows the annual seasonal trend for the IShares Financial Sector ETF (XLF).
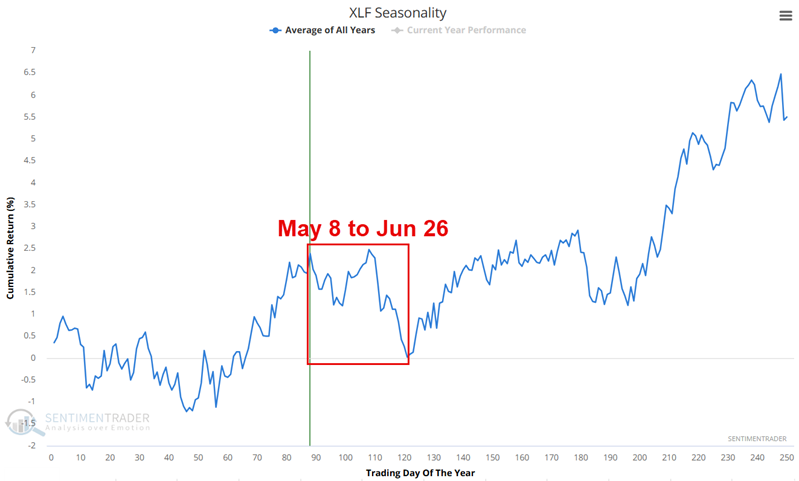
As you can see in the chart above, the odds do not favor the financial sector during the period from Trading Day of the Year (TDY) #88 to #121. For 2026, this period extends from the close on May 8 through the close on June 26. How has XLF performed historically during this period? The chart below shows the hypothetical growth of $1 invested solely in XLF during the TDY #88 through #121 each year since 1999, when XLF started trading.
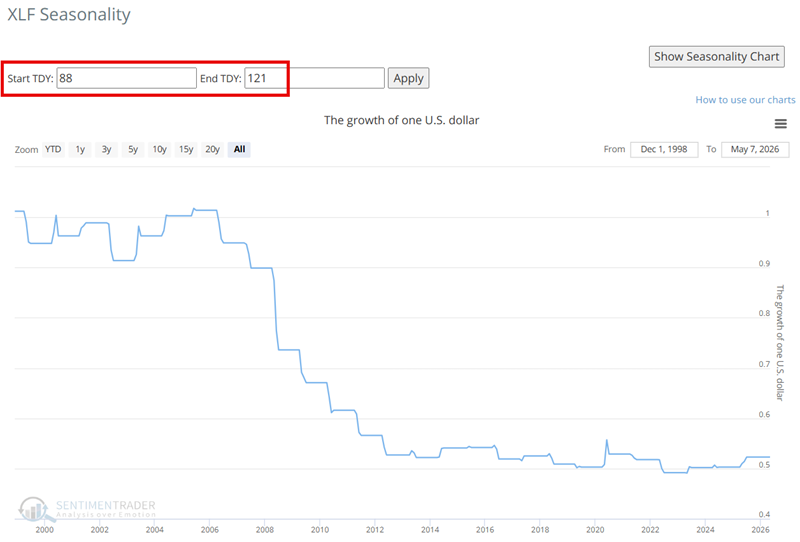
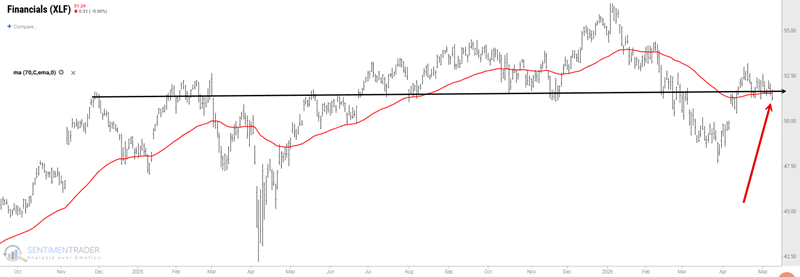
The results above are not meant to imply that XLF cannot rally between now and late June. They merely highlight the fact that it rarely does. The real question is, "Is this the best place to allocate capital?" Note in the chart below that the price has been moving sideways since November 2024 and recently dropped below its 70-day exponential moving average. In the current market environment, this qualifies as subpar performance.
Component Correlation also suggests below-average odds
Component correlation shows the correlation among members of a given sector. During times of panic, investors tend to buy or sell "everything" together, no matter their individual merits, so correlation rises. The higher it goes, the more we're seeing groupthink, which tends to occur during periods of extreme pessimism and is thus usually a positive for stocks going forward. When conditions are calm and investors become complacent, they trade stocks on their own merits, and correlation drops. That tends to lead to below-average returns for the sector going forward. Note that it is presently at the low end of the historical range at 0.522.
The chart below highlights all dates when the XLF Component Correlation indicator was at 0.525 or lower.
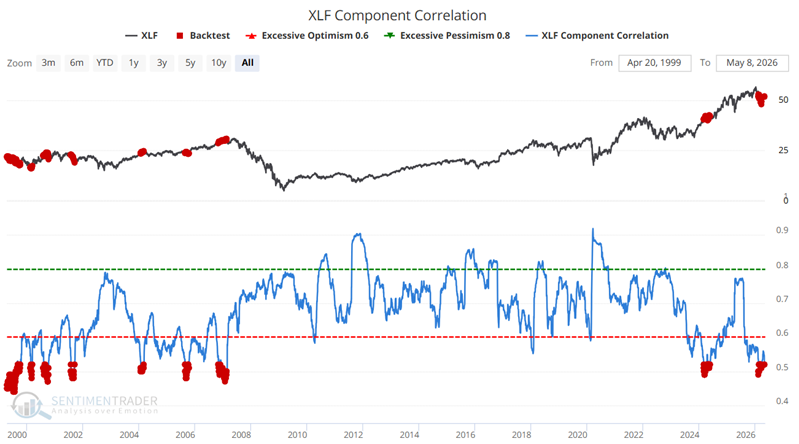
So, how has XLF performed in the past when component correlation was this low? The table below summarizes XLF performance following the dates highlighted in the chart above.

Once again, the values in the table above do not scream "Sell everything!" But they do raise the important question, "Is this where I want to allocate capital presently?" Given the ETF's lackluster price performance and the indicators' historical subpar performance, investors may find better opportunities elsewhere.
The Turkish stock market also looks vulnerable
The iShares MSCI Turkey ETF (ticker TUR) seeks to track the investment results of a broad-based index composed of Turkish equities. The ETF has been on a run lately, having advanced 42% since June 2025. In the chart below, we see that the price is approaching a long-term line of demarcation near $43.59 a share.
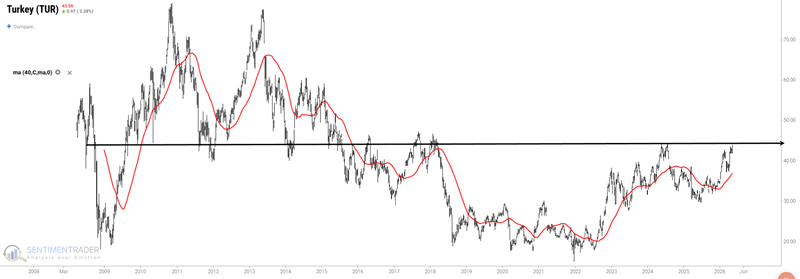
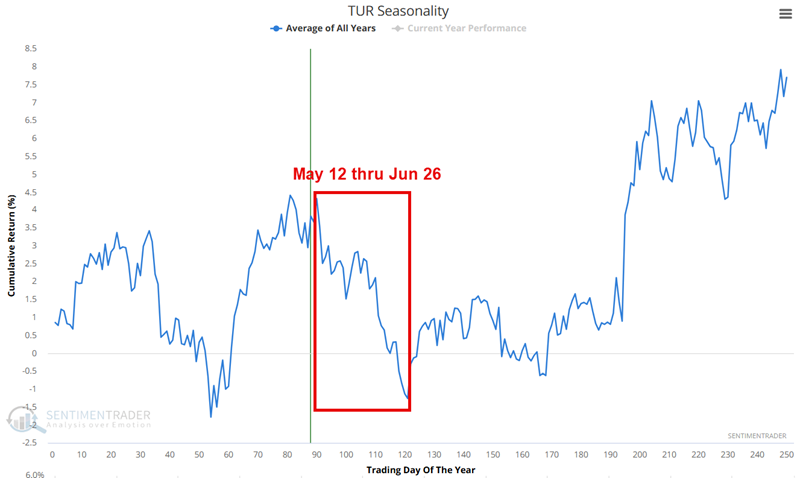
If price breaks through to the upside, it could continue to run. But unless and until that happens, investors might wish to stand aside. Let's highlight two primary concerns. Like the financial sector, TUR is soon entering an unfavorable seasonal period. An unfavorable period runs from Trading Day of the Year #90 through #121. For 2026, this period extends from the close on May 12 through June 26.
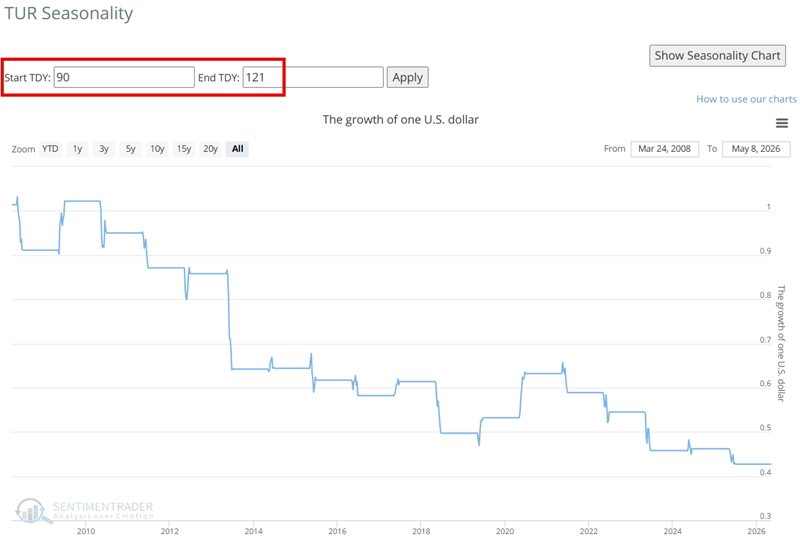
 The chart below shows the hypothetical growth of $1 invested in TUR only during this period every year since 2008.
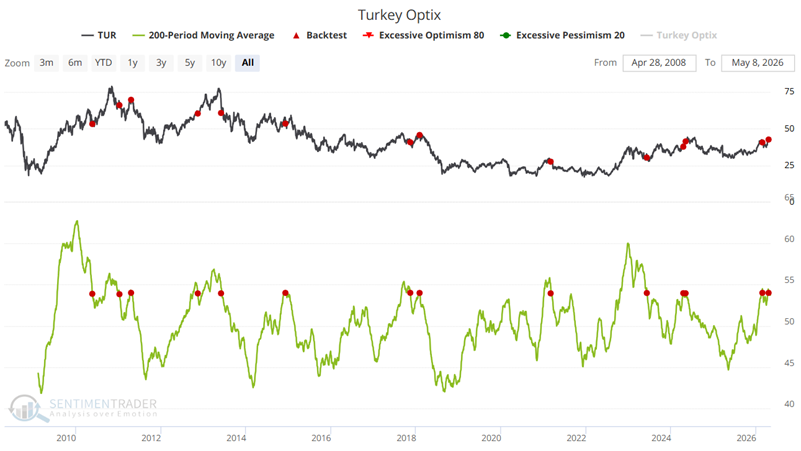
Long-term sentiment regarding the Turkish stock market recently backed off from an extreme. The chart below highlights all dates on which the 200-day average of TUR Optix fell below 54. The most recent signal occurred on April 24th.
The table below summarizes TUR performance during the year after each signal.

The table below shows TUR performance following each previous signal.
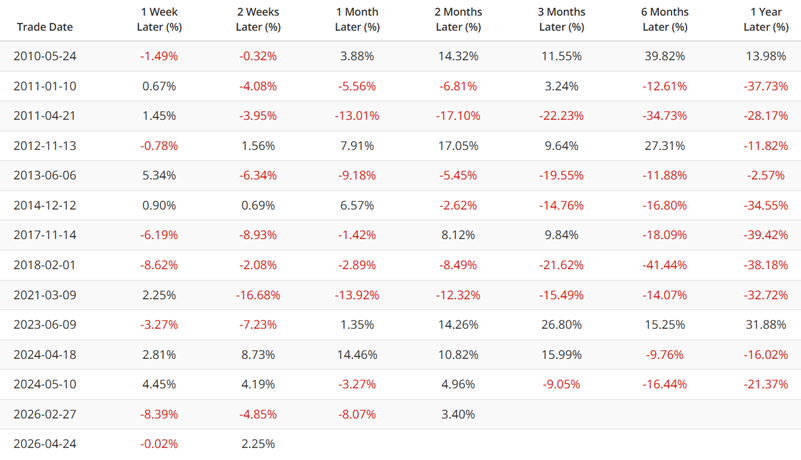
A close perusal of the table above reveals that TUR is more than capable of staging a significant rally following an unfavorable Optix signal. But again, as a weight-of-the-evidence tool, the overall numbers reveal a strong tendency toward below-average performance following a signal. For now, that is enough to compel me to steer clear.
What the research tells us…
The indicators and results detailed above suggest subpar results for the financial sector and the Turkish stock market in the months ahead. Nothing more, nothing less. So please remember that the argument being made here is not that the financial sector or Turkish market is doomed to crash, nor that investors should sell short every financial or Turkish stock they can find. In fact, I am not even arguing that an investor should sell everything they presently hold in these sectors. No, the argument being made is simply that a) Now is not the time to make new commitments to the financial sector or Turkish market, and b) investors who hold stocks in these areas should adjust their expectations for the next several months.