
Two all-weather sectors for May

Key points
- Sector performance can vary significantly from month to month
- Monthly sector performance can vary considerably from year to year
- That said, two sectors, in particular, have stood out during May
A look at May's performance
For testing purposes, we will start the test in 1945 (Post WWII) using the Fama French Index database from 1945 to 1991 and the S&P 500 sector index database after that. For this test, we will look at the total return for each of the 11 major S&P 500 sectors only during May each year.
The factors considered are:
- Cumulative % +(-)
- % of UP months
- Average monthly % +(-)
- Median monthly % +(-)
- Standard Deviation %
- Average % / Standard Deviation %
The table below displays the raw output.
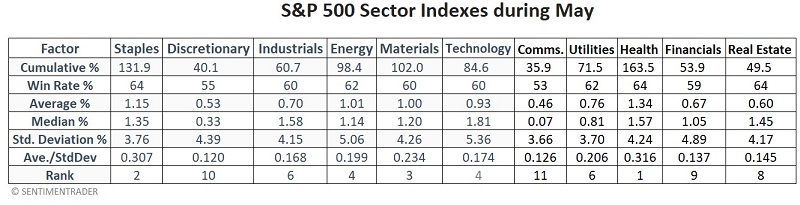
Note the "Rank" row at the bottom of the table above. To arrive at this rank, we:
- Ranked each sector from 1 to 11 for each factor
- Summed up the total value of all rank values for each sector
- The sector with the lowest total sum is ranked #1, and the sector with the highest total rank sum is ranked #11.
Health Care and Consumer Staples are the top two sectors for May using this methodology. The bottom two rated sectors for May using this methodology were Communications and Consumer Discretionary
A closer look at May sector performance
So do the rankings above mean investors should pile into Health Care and Consumer Staples and eschew all other sectors? Not necessarily. Remember that on a year-by-year basis, absolutely anything can happen. Still, to highlight potential reasons to consider these rankings, let's examine the performance of the top two sectors compared to the bottom two sectors and all sectors combined.
The chart below displays the cumulative growth of $1 invested separately in:
- The Top 2 sectors (black line)
- All sectors combined (blue line)
- The Bottom 2 sectors (green line)
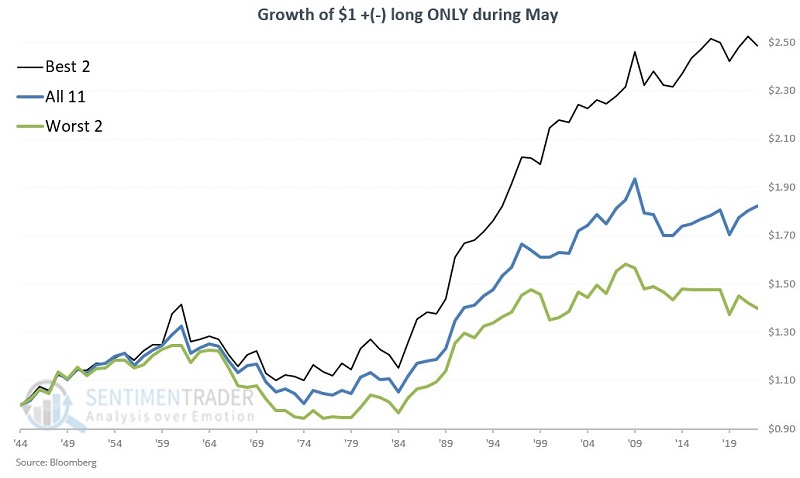
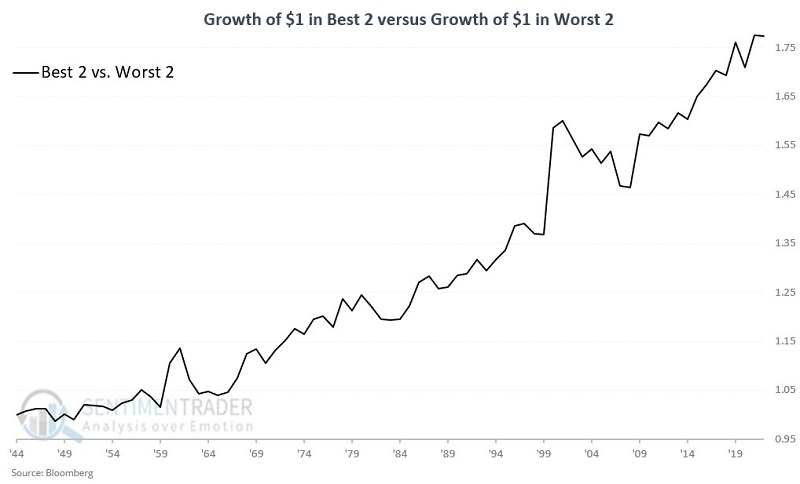
The Top 2 are not a "sure thing" in any given year or timeframe. Still, the overall results over the past 78 years have been superior. To further illustrate this relative performance, the chart below displays the growth of $1 invested in the Top 2 sectors divided by the growth of $1 invested in the Worst two sectors.
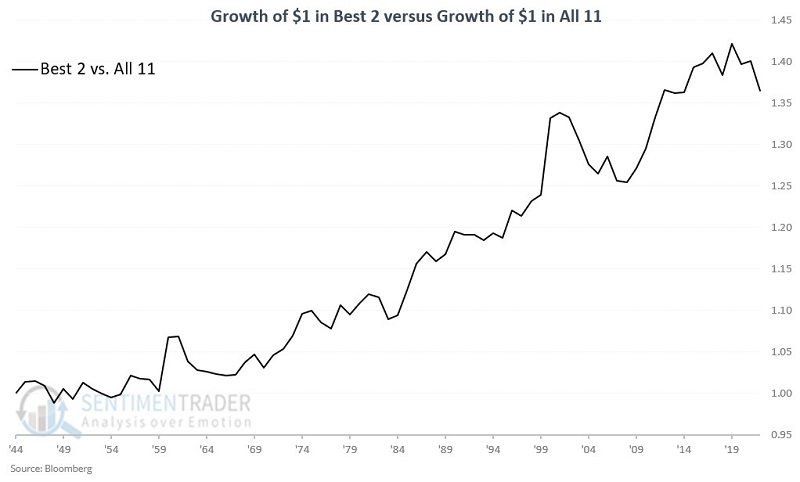
The chart below displays the growth of $1 invested in the Top 2 sectors divided by the growth of $1 invested in all 11 sectors.
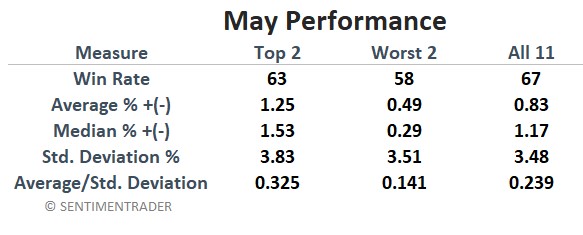
The table below summarizes performance for the Top 2, Worst 2, and All 11 sectors.
What the research tells us…
The purpose of this piece is not to convince anyone that they should pile into health care and consumer staples during May 2023. That said, over the past 78 years, these two sectors have exhibited a level of return and consistency not matched by other sectors. The other purpose is to highlight the potential for above-average returns for investors willing to dig a little deeper and accept a potentially higher level of volatility inherent with a lower level of diversification.