
Two additional S-TCTM Risk Warning Model members trigger risk-off signals

Key points
- Two additional sub-components of the S-TCTM-the NYSE 52-Week High-Low Ratio and the Important Cyclical Groups Divergence Model-have flashed tactical risk-off signals.
- Historically, these specific internal divergences precede sub-par market performance, highlighting elevated near-term downside risk across 1-to-6-month timeframes.
- Although the overarching Composite Risk Warning Model hasn't issued a formal alert due to unmet reset conditions, an elevated signal count of 40% warrants heightened vigilance and strict risk management.
NYSE 52-Week High-Low Ratio Risk-Off Model
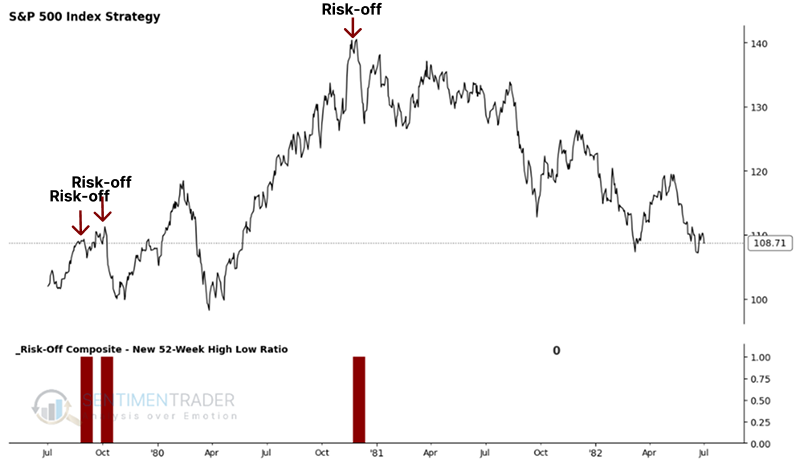
The NYSE 52-Week High-Low Ratio model seeks to identify historical instances where new lows exceed new highs by a ratio of 1.5 or greater, specifically when the S&P 500 index is trading within two days of a 252-day high. The quantitative model issues an alert based upon the following strict parameters.
Signal Criteria
- Condition 1 = NYSE New Lows / New Highs Ratio >= 1.5.
- Condition 2 = S&P 500 is less than 2 days from a 252-day high.
- Condition 3 = The NYSE New Lows / New Highs Ratio crosses above 1.0.
- If Conditions 1-3 are met, a risk-off signal is issued.
Current Day Chart
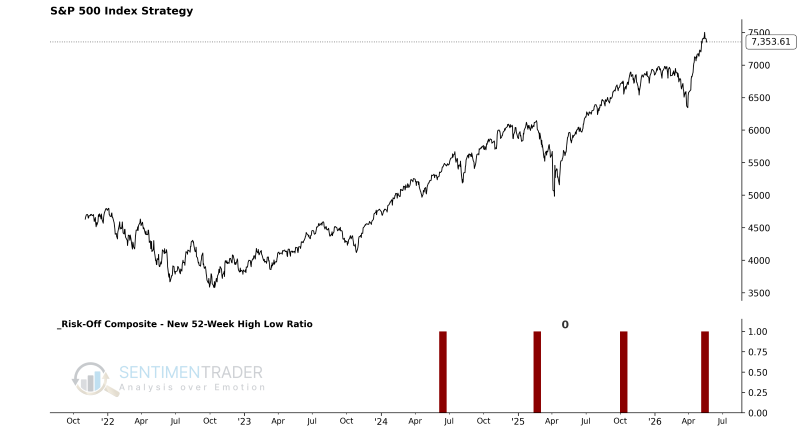
2015-16 Oil/Commodity Bear
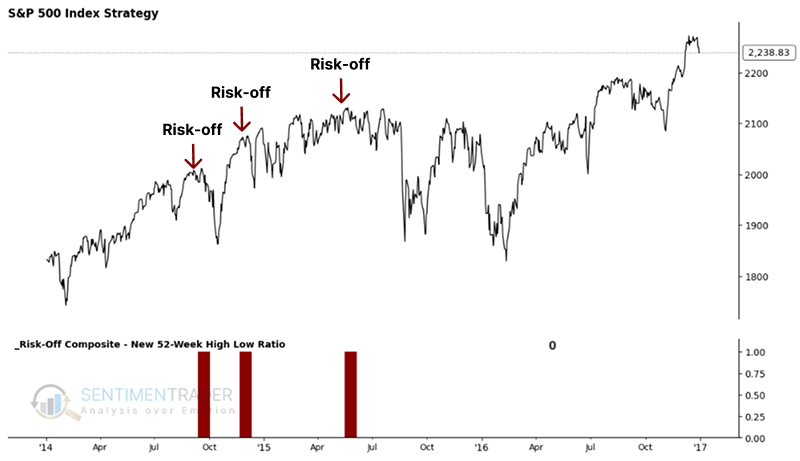
2000 Internet Bubble
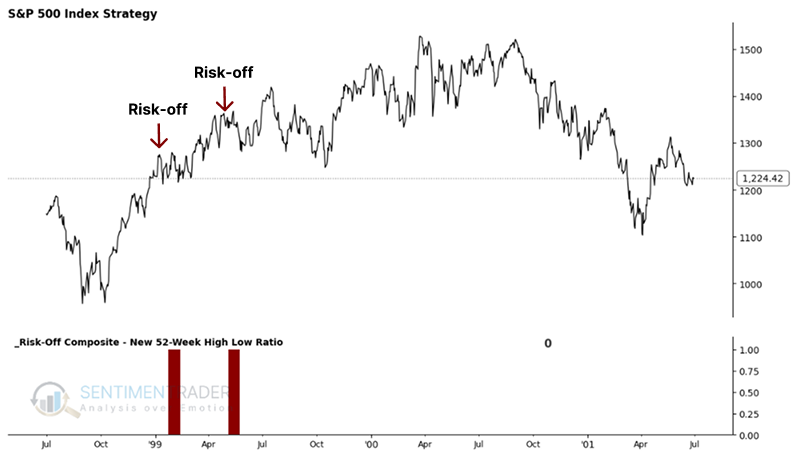
1990 Savings & Loan/Iraq Oil Spike
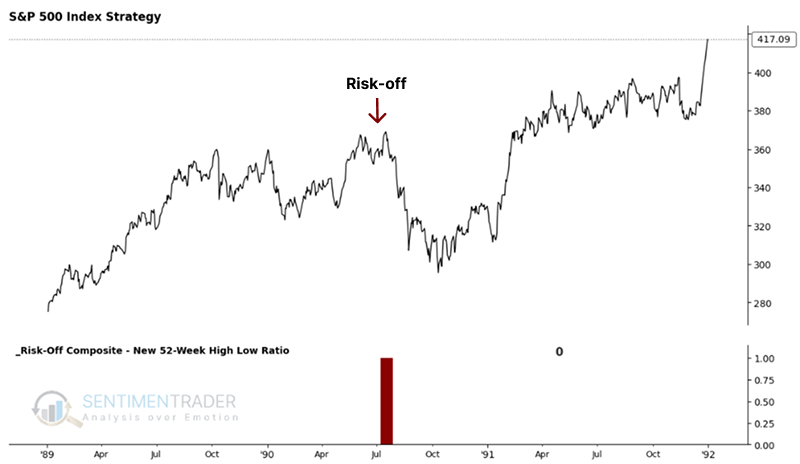
1980 Energy/Commodity Bubble
Signal Performance
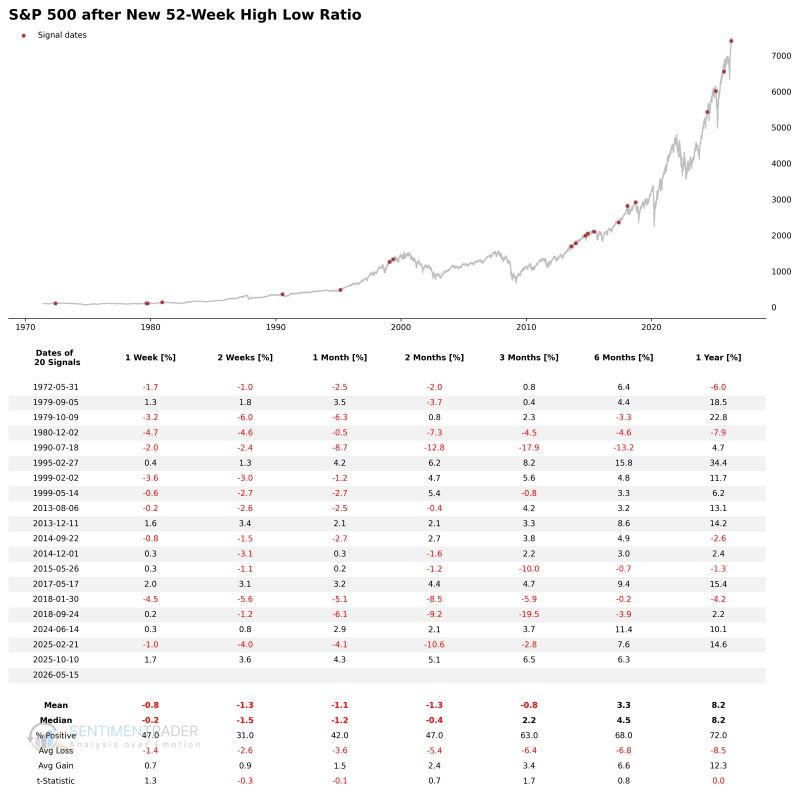
As the data illustrates, forward performance across all measured timeframes is historically sub-par following this alert. The win rate is particularly weak during the immediate two-week window, reflecting acute short-term downside momentum.
Important Cyclical Groups Divergence Model
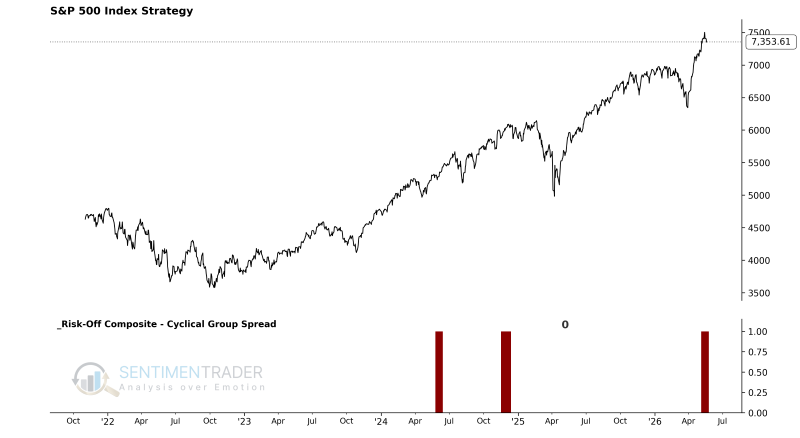
The Important Cyclical Groups Divergence Model aggregates Financials with several other economically sensitive sectors. The underlying premise is straightforward: a healthy economy and a durable bull market should be supported by a favorable, confirming trend across a composite of these critical cyclical groups. While they do not necessarily have to lead the tape, we aggressively monitor against any significant divergence from the overall market's primary uptrend.
Indicator Construction
This indicator measures the average percentage that each of the following groups is below its 252-day high: Autos, Transports, Homebuilders, Consumer Discretionary (Equal Wt), Financials (Equal Wt), Industrials (Equal Wt), and Small Caps. All groups are weighted equally within the composite.
Signal Criteria #1
- Condition 1 = The composite indicator crosses above -3% (i.e., a reset).
- Condition 2 = The 1-month linear regression trend of the composite is negative.
- Condition 3 = The 4-month linear regression trend of the composite is negative.
- Condition 4 = S&P 500 is <= 3.0% from its 252-day high.
- Condition 5 = The composite indicator crosses below -6%.
- If Conditions 1-5 are met, a risk-off signal is issued.
Signal Criteria #2
- Condition 1 = S&P 500 closes at a 252-day high.
- Condition 2 = The 2-month linear regression trend of the composite is negative.
- Condition 3 = The composite indicator is down >= -28%.
- If Conditions 1-3 are met, a risk-off signal is issued.
Current Day Chart
Signal Performance
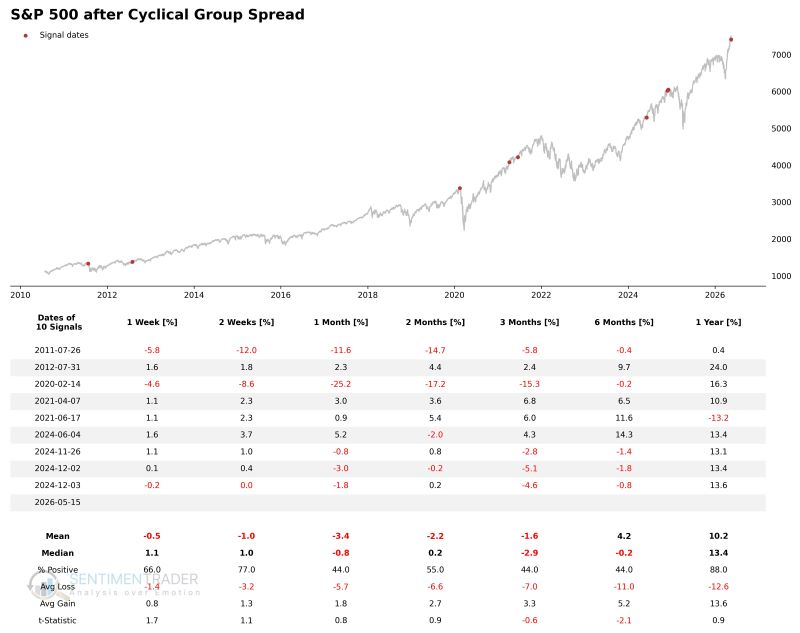
As the performance table below demonstrates, this specific divergence triggers several highly unfavorable risk periods, particularly concentrated within the one-to-six-month timeframe.
A single arrow is easily broken, but not ten in a bundle
For the broader Composite Risk Warning Model to issue a formal, systemic alert, the composite signal count must reach a threshold of at least 30%, AND the S&P 500's 5-day rate of change must be -1% or worse within a 20-day window.
At present, this overarching condition remains unmet because its required reset criteria-the composite count dropping below 20%-has yet to be satisfied. However, with the Composite Risk Warning Model's signal count currently sitting at an elevated 40%, the prevailing market environment is fraught with underlying risk. While this does not guarantee the current pullback will cascade into a severe, structural correction, traders must remain highly vigilant, tightening stops and adjusting their risk exposures accordingly.
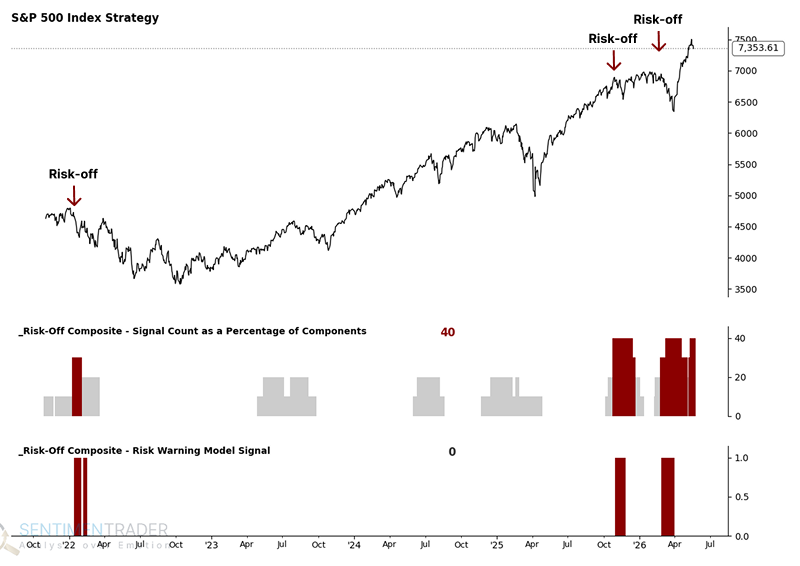
Below are the details of the components within this composite.
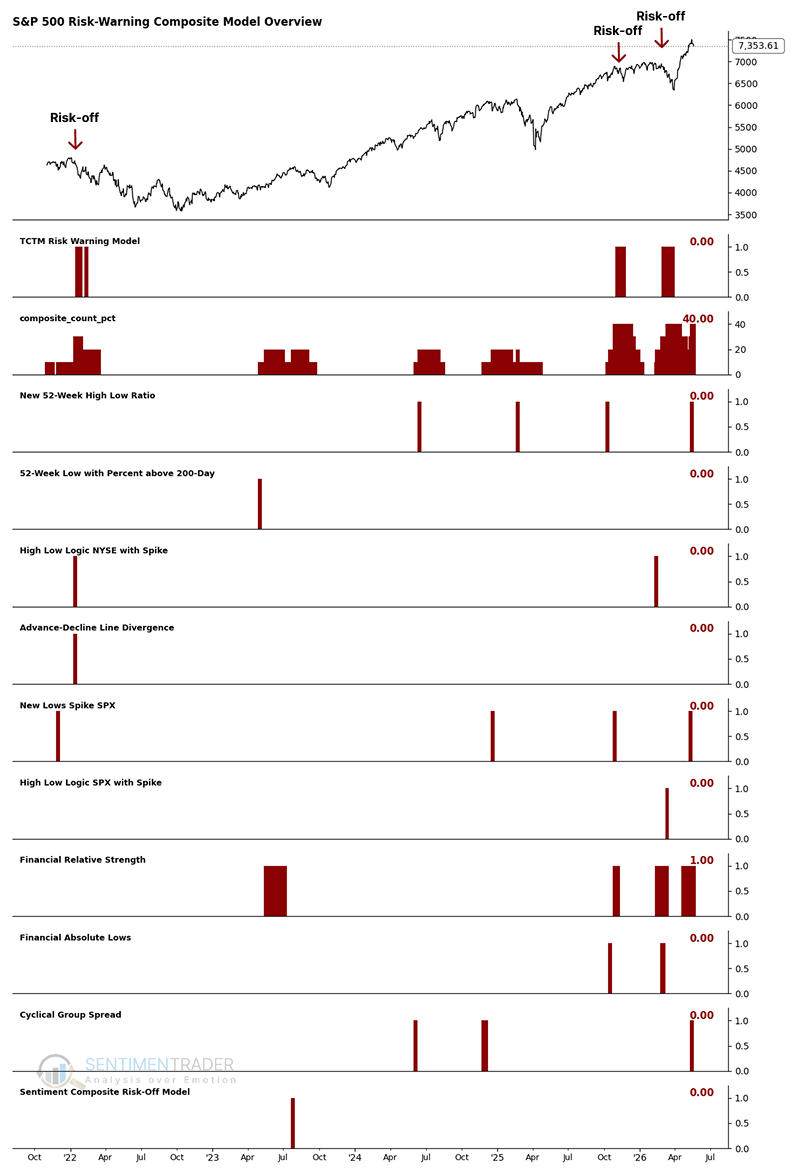
What the research tells us...
Beneath the surface of the major indexes, market internals are exhibiting clear signs of exhaustion and divergence. The simultaneous triggering of risk-off signals from both the NYSE 52-Week High-Low Ratio and the Important Cyclical Groups Divergence Model confirms that market breadth is narrowing and cyclical leadership is fracturing. Historically, when these defensive crosscurrents emerge near 252-day highs, the S&P 500 consistently experiences elevated volatility and sub-par forward returns over the immediate 1-to-6-month window. While the primary Composite Risk Warning Model has not officially flashed a systemic sell signal, a heavy 40% signal count dictates that the current environment is highly vulnerable. Traders should exercise extreme caution, avoid chasing extended breakouts, and actively manage downside risk.