Products
SentimenTrader Trading Tools
‍
Backtest Engine
My Trading Toolkit
Correlation Analysis
Seasonality
Indicators & Data API
‍
Proprietary Indicators & Charts
Market Data API
Strategies & Scanner
‍
50+ Trading Strategies
Smart Stock Scanner
Research Reports
‍
Research Solutions
Reports Library
Free Resources
Simple Backtest Calculator
Simple Seasonality Calculator
The Kelly Criterion Calculator
Sentiment Geo Map
Public Research Reports
Pricing
Company
About
In the News
Testimonials
Client Success Stories
Contact
Log inLoginSign up
< BACK TO ALL REPORTS

Tuesday Midday Color - Overseas Carnage, Sweet Sugar

Jason Goepfert
2019-05-07
null

Here's what's piquing my interest so far this morning.

We saw last week that selling impulses similar to what triggered then have tended to occur near major peaks in the Shanghai Composite. While there are some long-term positives associated with the kind of momentum move that index enjoyed off its low, the sudden burst of concentrated selling is a shorter-term worry.

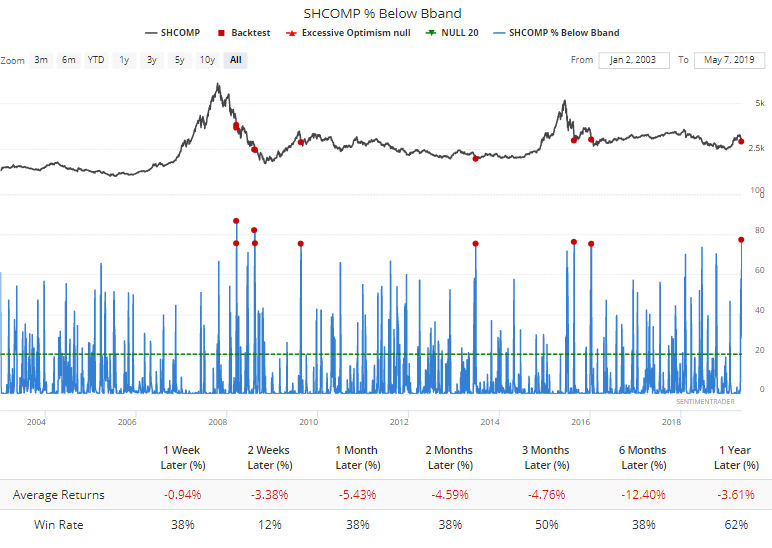
With the big decline to start the week, nearly 80% of stocks in that index dropped below their lower volatility bands. That screams like it should mean stocks are oversold and due to rebound, but in that market it hasn't usually worked out that way.

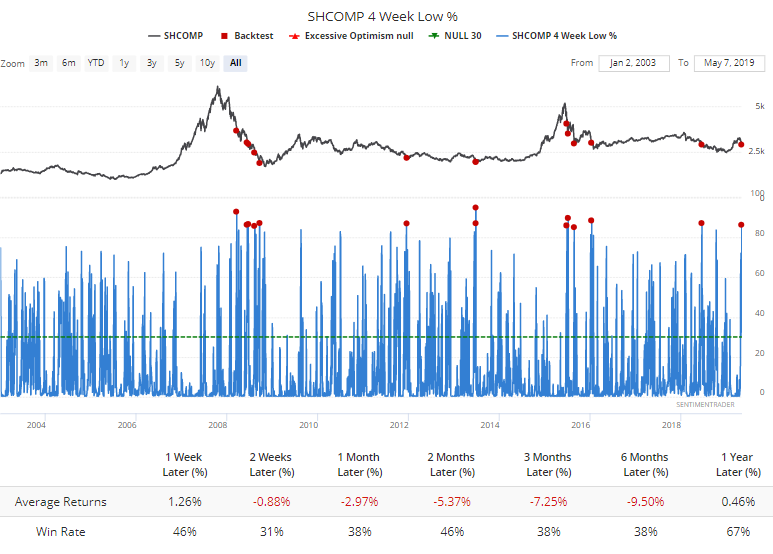
Same goes for times when more than 85% of the stocks hit a one-month low.

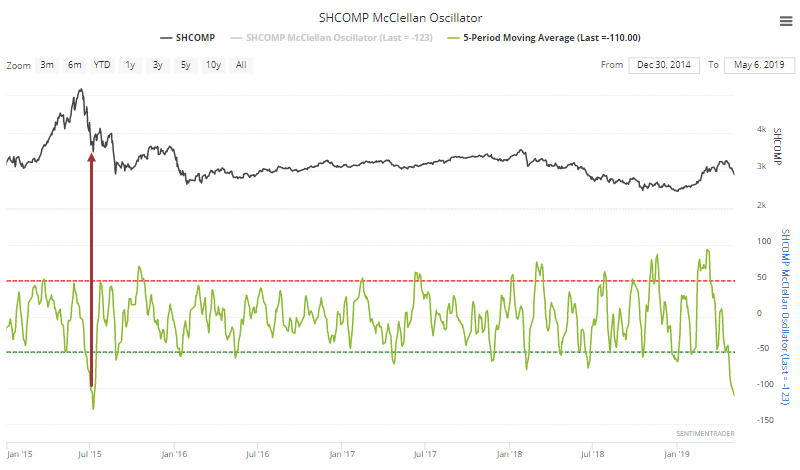
The 5-day average of the McClellan Oscillator for the Shanghai dropped below -100 for only the 2nd time in at least the past 17 years. That one immediately preceded a sharp snap-back, but it was only the first move in a major topping process.

Due in part to the influence of weakness in Chinese shares, emerging market indexes also showed very weak breadth and selling impulses. Nearly a third of stocks dropped below their Bollinger Bands (the charts aren't displaying correctly due to differences in trading days because of exchange holidays overseas).

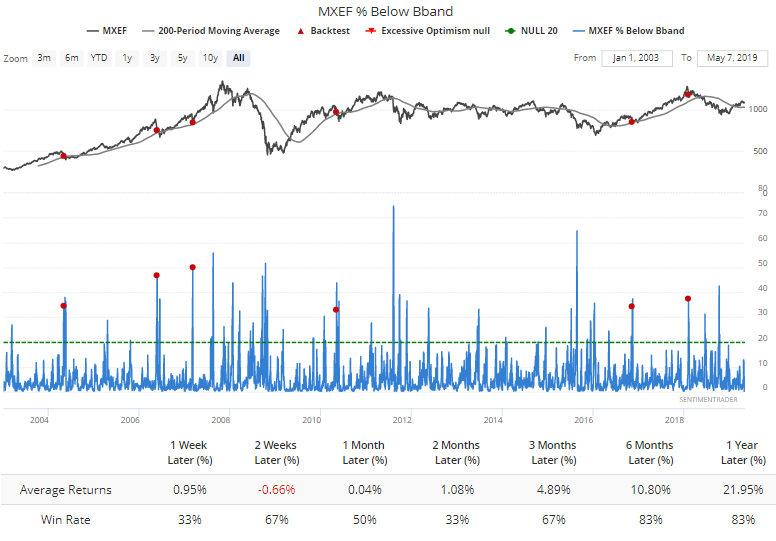
More than 50% of them hit new one-month lows.

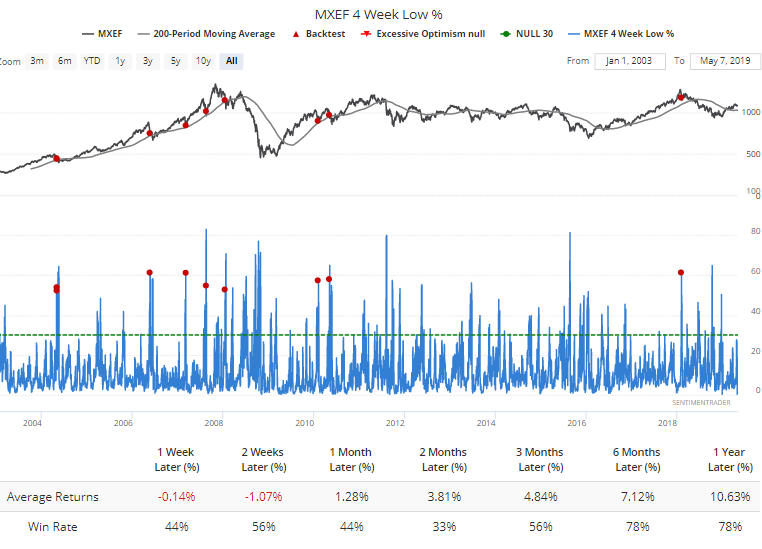
In both studies, returns over the next couple of months were positive, but only a third of the signals showed positive returns. That means there were huge variations in those returns - the signals typically led to binary outcomes. Either emerging market stocks bottomed quickly and showed large gains over the medium-term, or these signals coincided with topping processes. The shorter-term reaction to these extremes should help give a clue as to which it is.

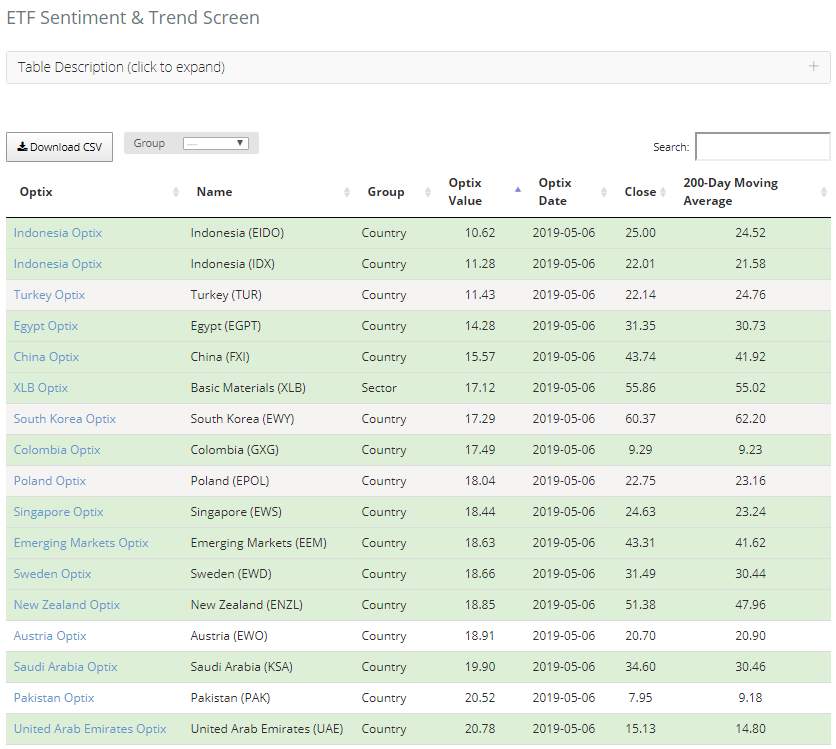
The overseas selling was enough to push many of the country ETFs into extreme pessimism while they're still trading above their 200-day averages (the ones highlighted in green).

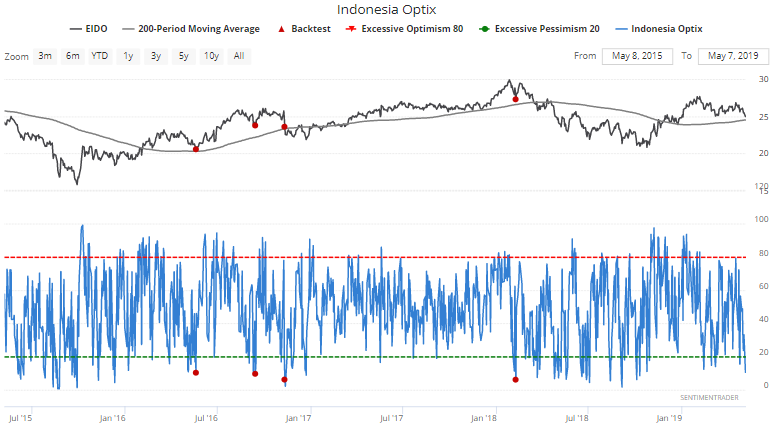
Over the past few years, that's been a good sign for EIDO.

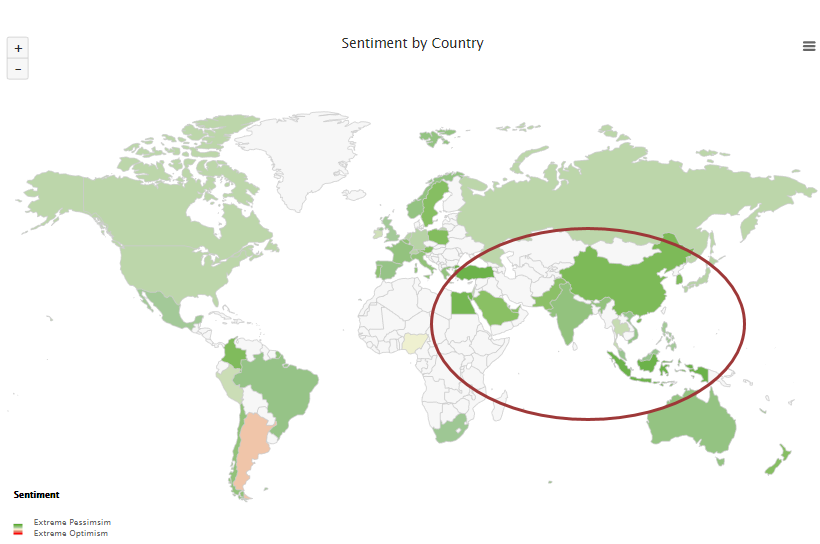
The Geo-Map gives a hint where the least optimism is right now (the darker the green color, the less the optimism). It's not just Indonesia, but focused in the Middle East and Asia.

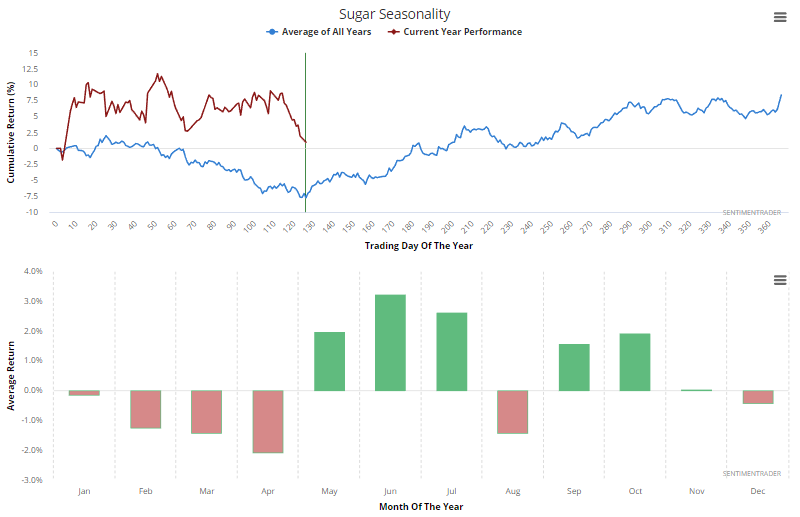
There is some pessimism in a few commodities that have good seasonality this time of year, too.

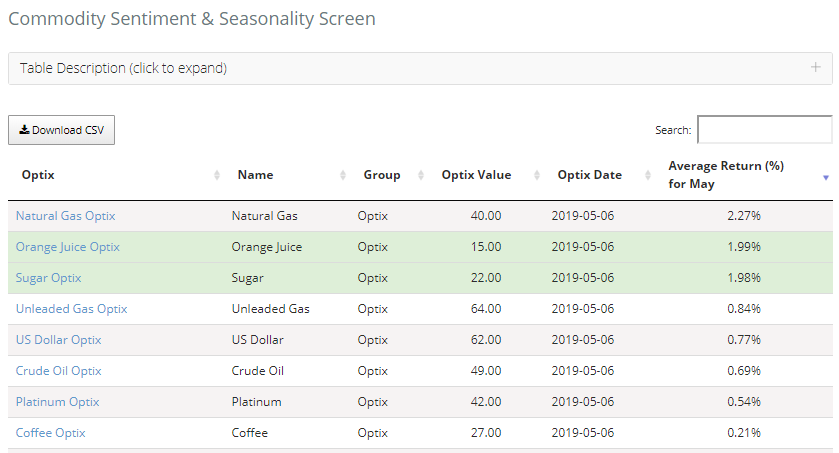
Most notable is sugar, where optimism is very low...

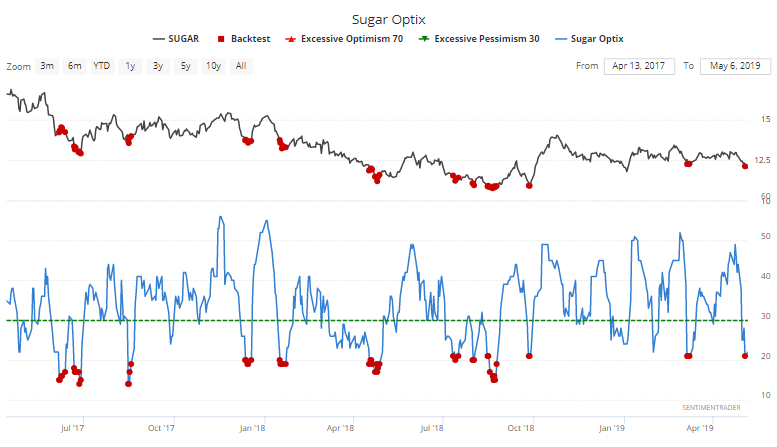
...just as it nears its seasonal sweet spot.

Sorry, you don't have access to this report

Upgrade your subscription plan to get access
Go to Dasboard
PRODUCTS
SentimenTrader
Trading Tools
Indicators & Data API
‍
Strategies & Scanner
‍
Research Reports
FREE
RESOUrCES
Simple Backtest
Calculator
Simple Seasonality
Calculator
The Kelly Criterion
Calculator
Sentiment Geo Map
‍
Public Research Reports
‍
Pricing
Bundle pricing
‍
Announcements
‍
FAQ
COMPANY
‍
About
‍
In the News
‍
Testimonials
‍
Client Success Stories
CONTACT
‍
General Inquiries
‍
Media Inquiries
‍
Financial Professionals Inquiries
‍
© 2025 Sundial Capital Research Inc. All rights reserved.
Setsail Marketing
TermsPrivacyAffiliate Program
Risk Disclosure: Futures and forex trading contains substantial risk and is not for every investor. An investor could potentially lose all or more than the initial investment. Risk capital is money that can be lost without jeopardizing ones’ financial security or life style. Only risk capital should be used for trading and only those with sufficient risk capital should consider trading. Past performance is not necessarily indicative of future results.

Hypothetical Performance Disclosure: Hypothetical performance results have many inherent limitations, some of which are described below. No representation is being made that any account will or is likely to achieve profits or losses similar to those shown; in fact, there are frequently sharp differences between hypothetical performance results and the actual results subsequently achieved by any particular trading program. One of the limitations of hypothetical performance results is that they are generally prepared with the benefit of hindsight. In addition, hypothetical trading does not involve financial risk, and no hypothetical trading record can completely account for the impact of financial risk of actual trading. for example, the ability to withstand losses or to adhere to a particular trading program in spite of trading losses are material points which can also adversely affect actual trading results. There are numerous other factors related to the markets in general or to the implementation of any specific trading program which cannot be fully accounted for in the preparation of hypothetical performance results and all which can adversely affect trading results.

Testimonial Disclosure: Testimonials appearing on this website may not be representative of other clients or customers and is not a guarantee of future performance or success.