Tuesday Midday Color - No Cash, Bullish On Bonds, Financials' Breadth

Here's what's piquing my interest so far on this month-end, yet-another-buy-on-weakness day.
No Cash
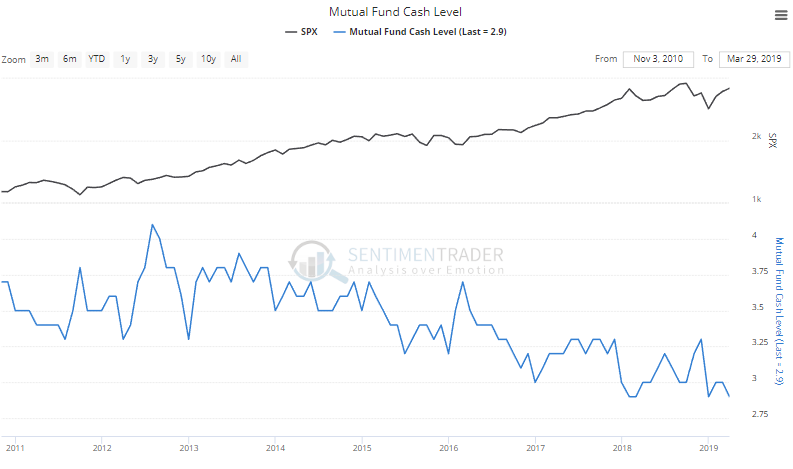
The latest data from the Investment Company Institute shows that mutual fund managers reduced their cash positions again in March. They're now holding 2.9% of client assets in liquid instruments, tied for the lowest on record.
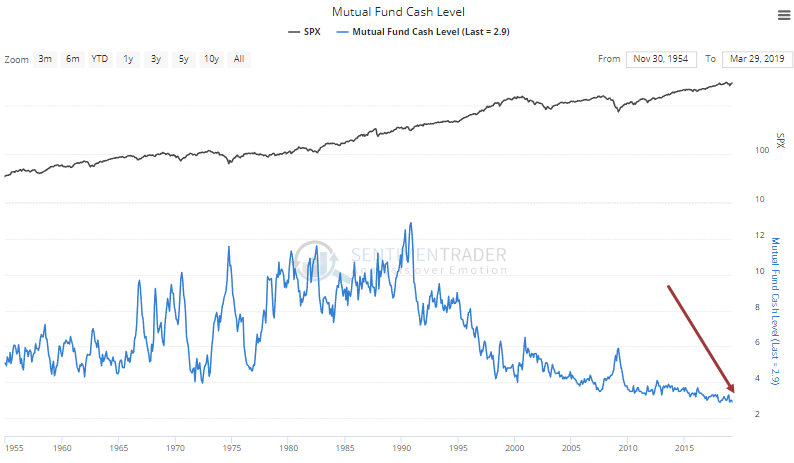
To see just how low that is historically, we can zoom out over the past 60+ years. There are many factors driving this beside complacency, but it does't change the fact that there isn't much of a cushion to brake a fall. That's been the case for years, FWIW.
Confident Consumers
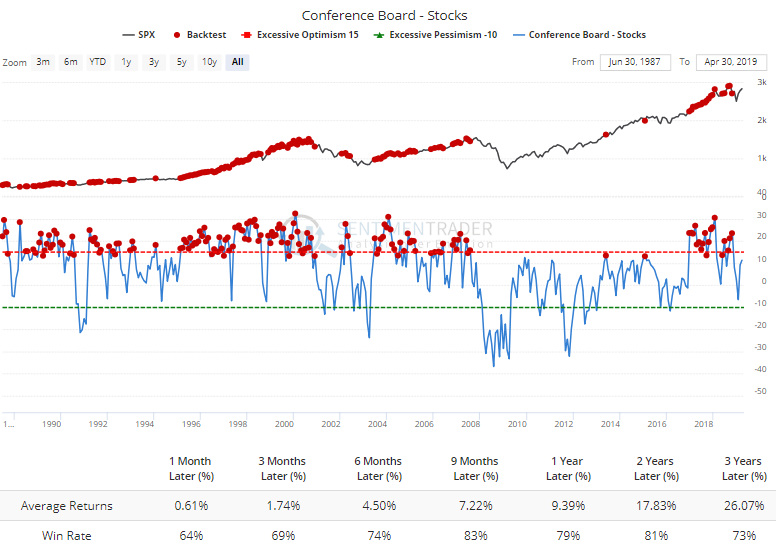
The Conference Board survey shows that a net 13% of consumers expect stocks to keep rallying in the months ahead. That's nearing the upper end of the range over the past few years.
But according to the Backtest Engine, there have been 160 months over the past 30 years with a reading this high or higher, and future returns in the S&P were about in line with random, maybe a tad weak.
In bonds, consumers have had a big change in heart. The net percentage expecting bonds to rise jumped significantly and is now at the 2nd-highest level in 5 years. The only higher reading was in July 2016 when bonds peaked (yields bottomed).
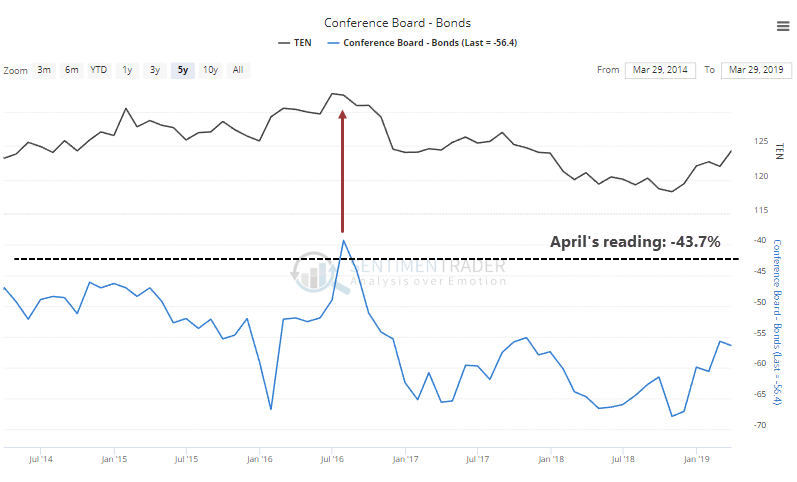
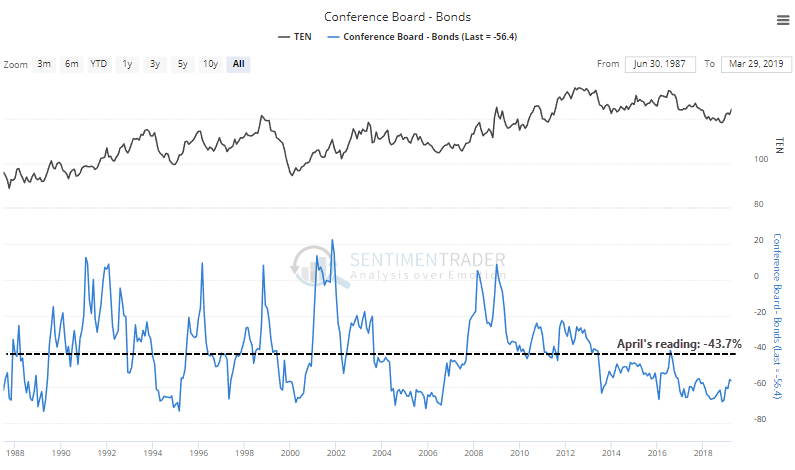
If we zoom out, though, it's about in the middle of the range over the past 30 years.
Breadth Review
The resumed rally in financials has been broad enough to push more than 80% of stocks within the S&P 500 Financial sector above their 200-day moving averages. Strong uptrends typically hold above this level.
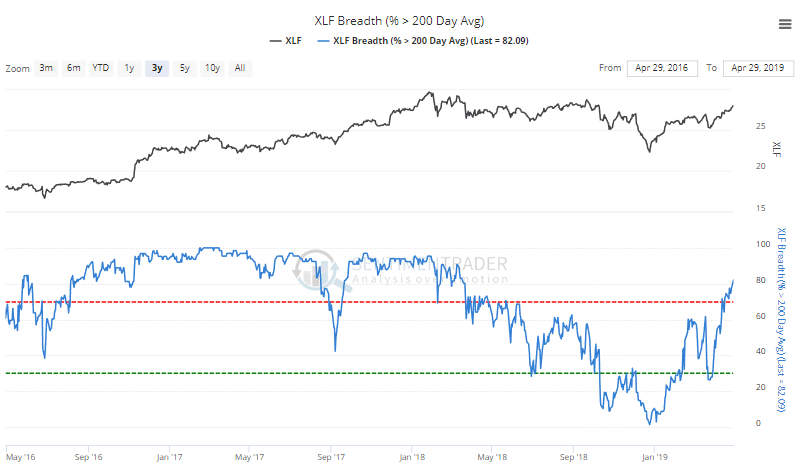
It has been quite a recovery, with almost all of them trading below their averages in December. Other times the % above their 200-day averages cycled from below 10% to above 80%, financials tended to keep rallying.
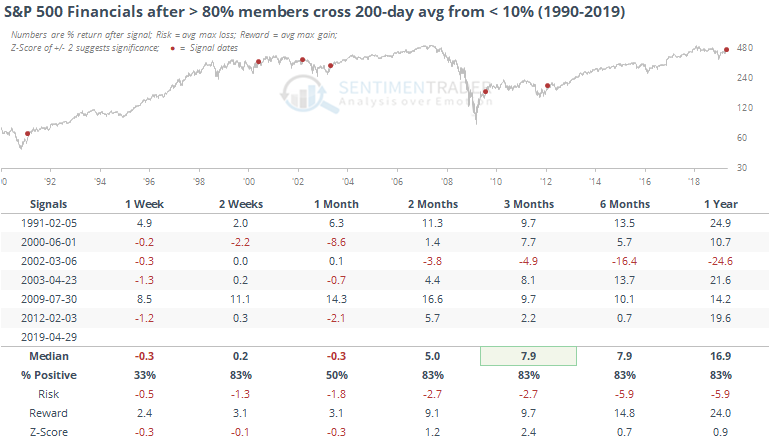
The big caveat here was 2002 which saw very limited upside in the weeks ahead, and then a major failure. That was the only one that didn't see at least an additional upside of more than 2% at some point within the next two months. On average, the maximum upside over that time frame was a whopping 9.1% versus risk of -2.7%.
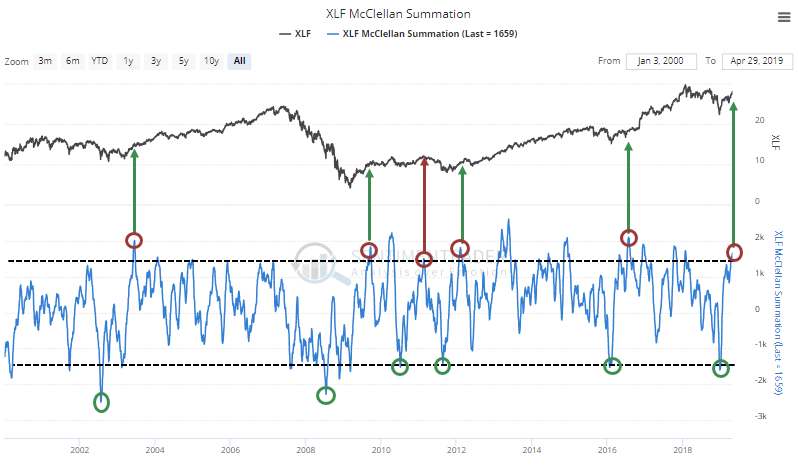
The breath recovery has caused the McClellan Summation Index to cycle from an extreme oversold to extreme overbought condition. Again, this has usually meant a lasting rally.
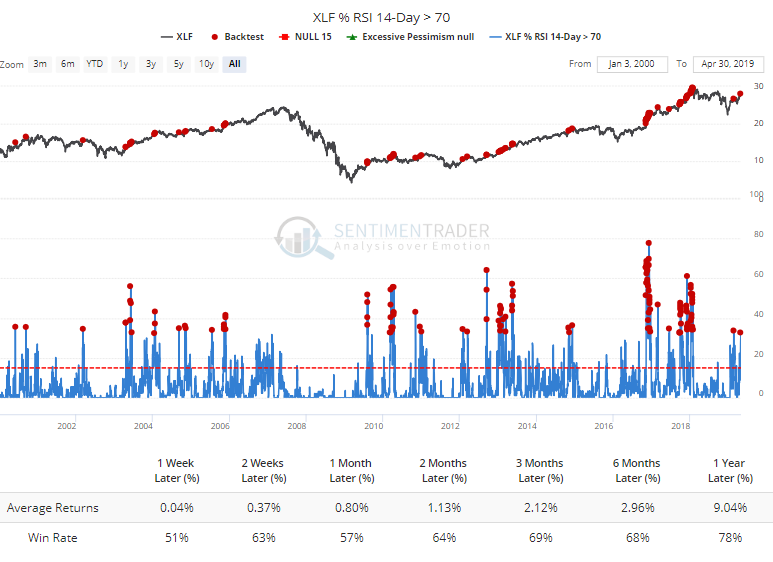
The latest push has triggered overbought conditions in nearly a third of financial stocks, but according to the Backtest Engine, that hasn't been a big cause for worry. Shorter-term returns were a little weak, but that's about it.
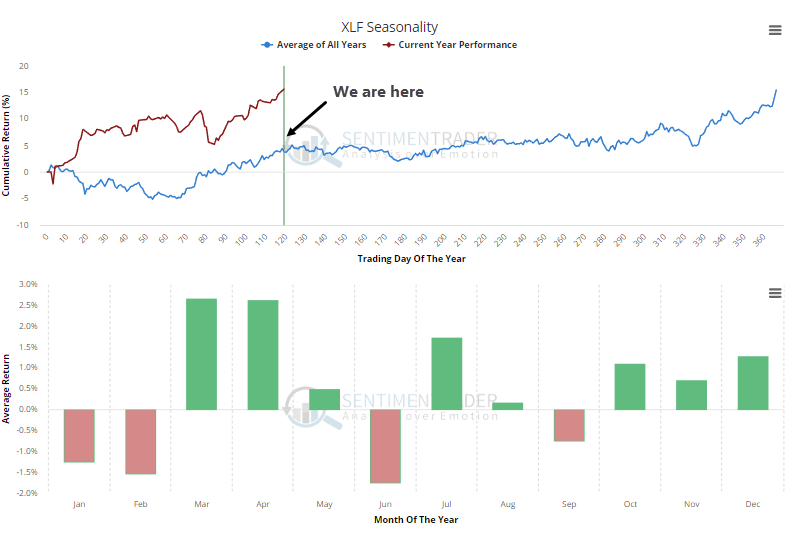
For what it's worth (not much), XLF tends to peak right about now. It hasn't followed its seasonal pattern very closely this year, so this is even more FWIW than usual.
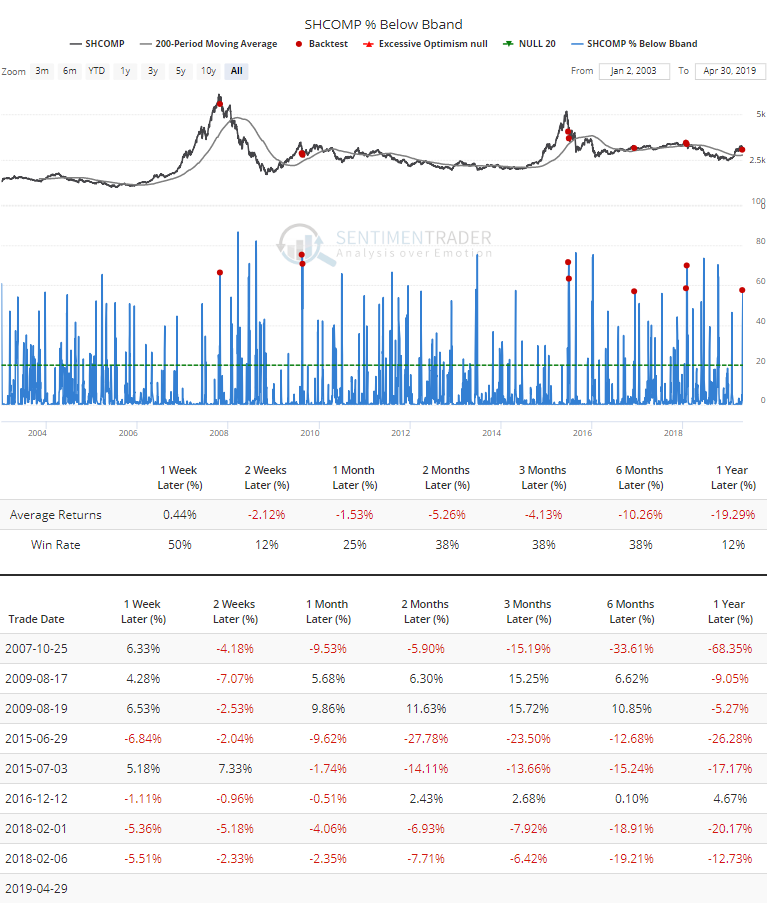
Overseas, we've touched on the Shanghai Composite a few times lately, as the selling pressure has hallmarks of a selling thrust. Coming on the heels of a large rally, in the past these kinds of short-term pressures have morphed into longer-term trouble. A little more evidence is that yesterday more than 57% of stocks in that index fell enough to exceed their lower Bollinger Bands, a measure of volatility in price moves over the past month.
When triggering during an uptrend (above its 200-day average), the Shanghai as struggled to recover.