Tuesday Midday Color - Shanghai, , DAX, Bond Bulls, Euro Sentiment

Here's what's piquing my interest so far today.
5 Straight
We saw at the end of last week that the Dow Industrials had just suffered its 5th straight negative week, a rarely-seen bout of selling pressure given the index is so near its high.
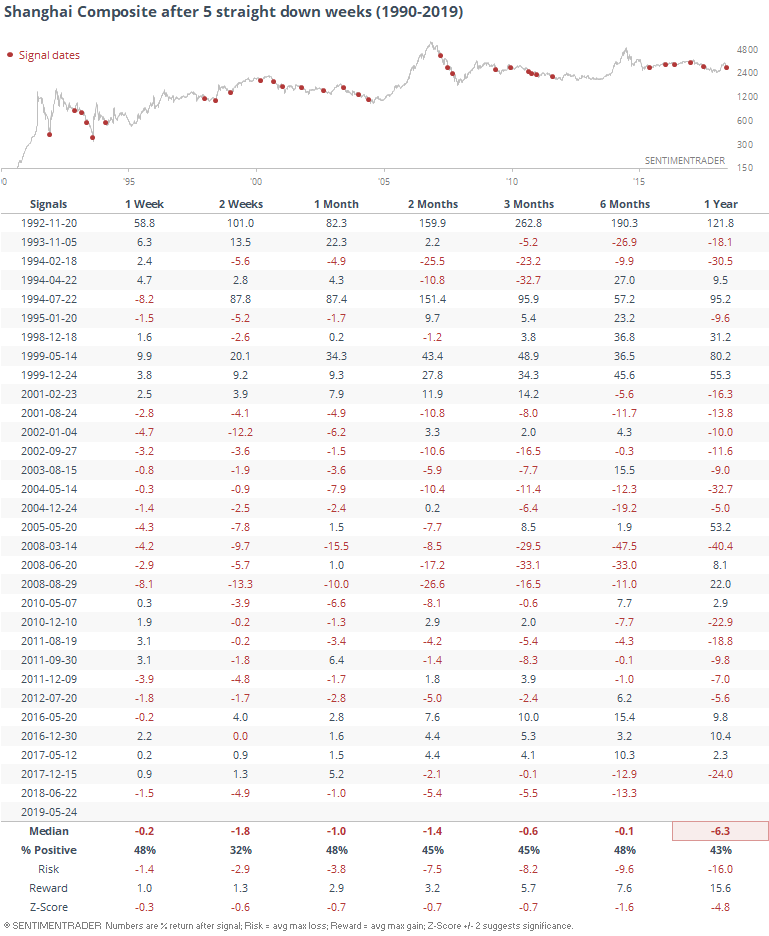
It's not the only index. The Shanghai Composite also suffered its 5th straight weekly decline. It usually hasn't been able to snap back quickly.
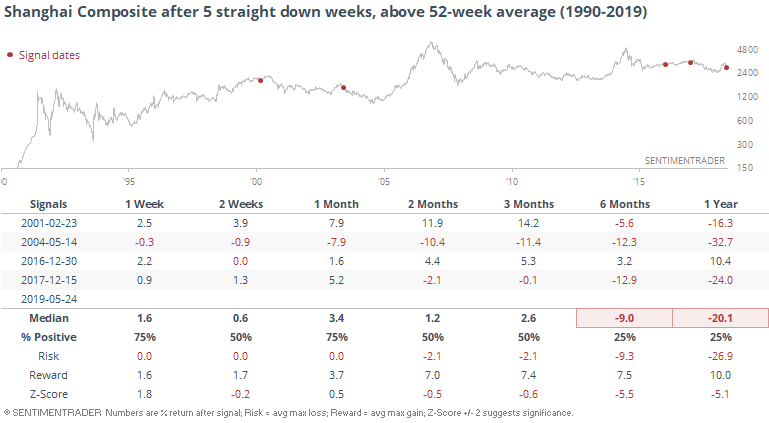
Like the Dow, however, this streak is coming after a relatively good stretch. This is one of the very few times the Shanghai has suffered such losses will still holding above its one-year average price.
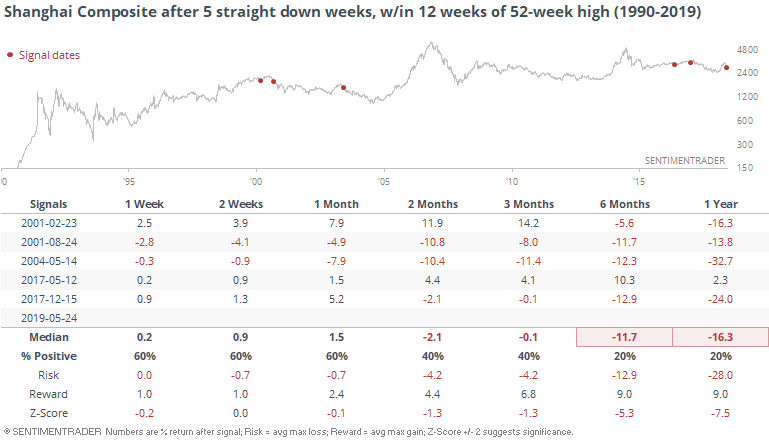
It's been more common to see this when the index is not in a bear market, loosely defined as still being within 20% of a 52-week high.
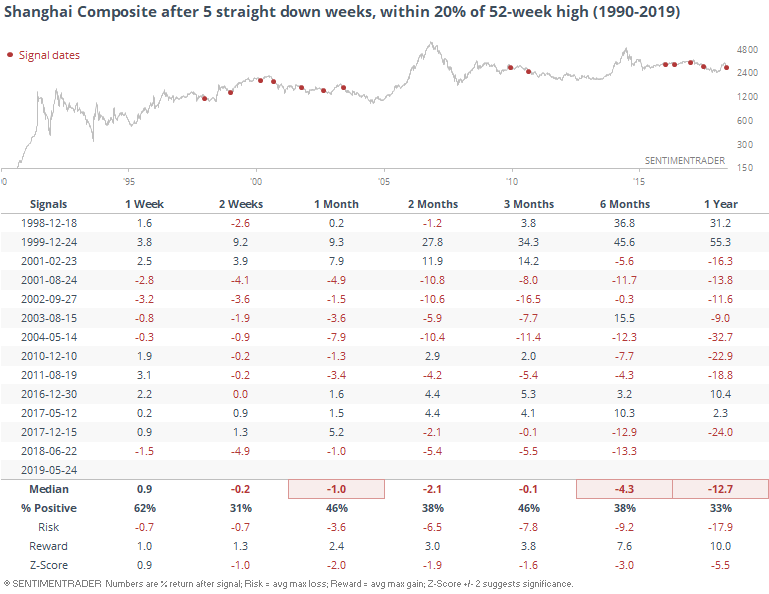
The Shanghai is also more than 10% off its 52-week low.
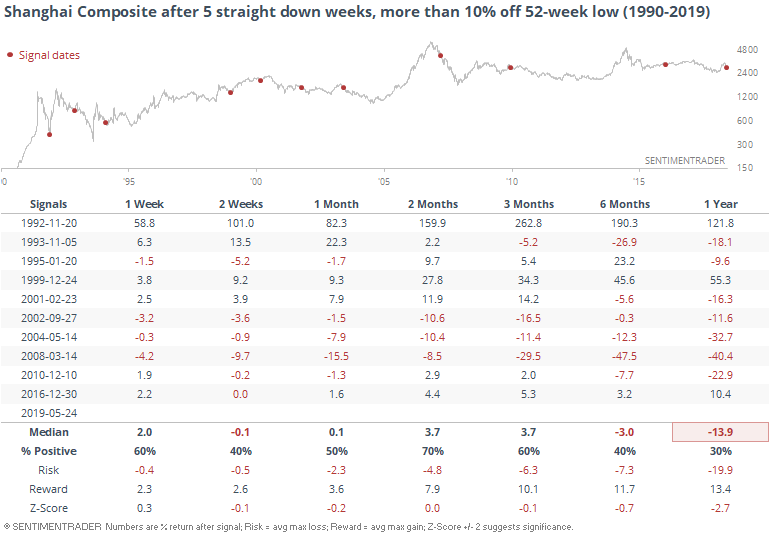
And it has been only a handful of weeks since the Shanghai was sitting at a 52-week high.
There aren't many ways to look at this that come out with a positive historical outcome.
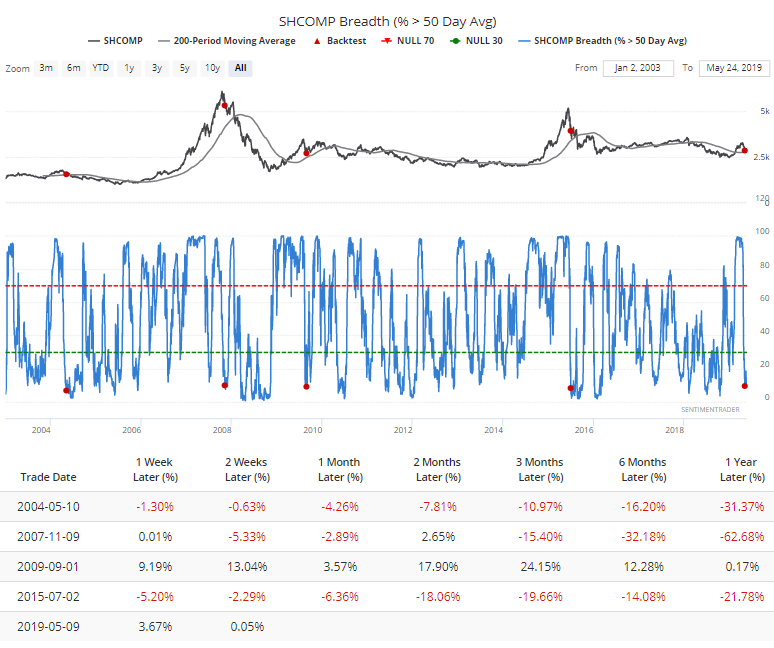
The selling has been widespread, and fewer than 10% of stocks in the Shanghai are still trading above their 50-day moving averages, despite the index still holding above its 200-day average. Three out of the four other times this triggered, it was the first wave of a longer-term selling impulse.
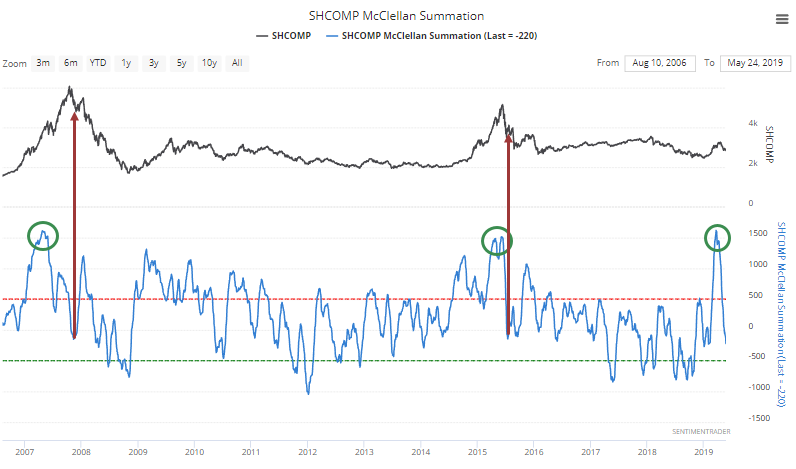
That can also be seen in the McClellan Summation Index, which went from above 1500 to negative territory. That's only happened twice before.
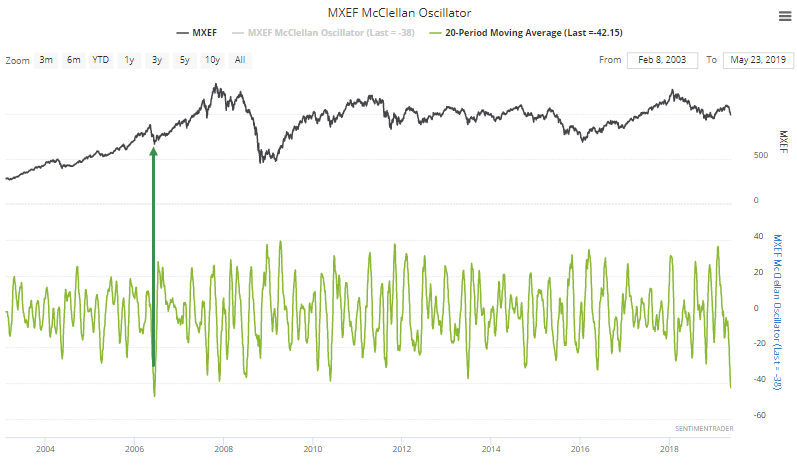
We're starting to see some breadth extremes in other markets, like emerging. The 20-day average of the McClellan Oscillator is nearing a 15-year low as we saw last week.
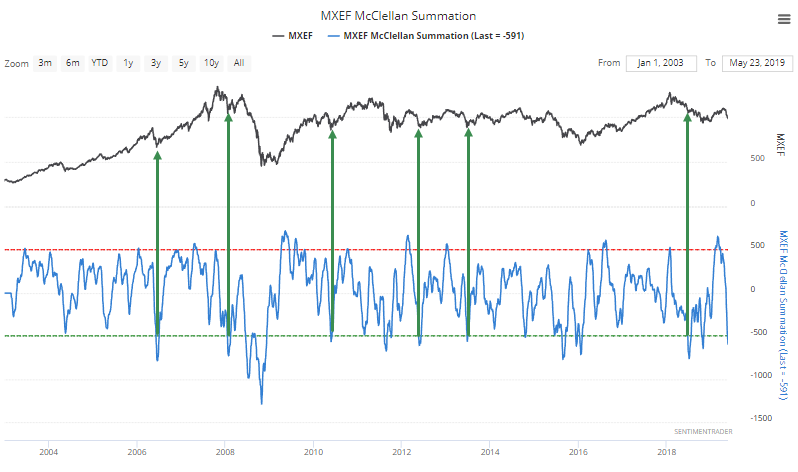
That has caused the Summation Index to cycle from above +500 to below -500, which has typically coincided with at least temporary reliefs from selling pressure, though the last one didn't work well.
Developed markets haven't been spared from a lack of underlying momentum. The DAX has had enough pressure in individual shares that its Summation Index has dropped below zero for the first time in almost four months. That's one of its longer streaks over the past few years.
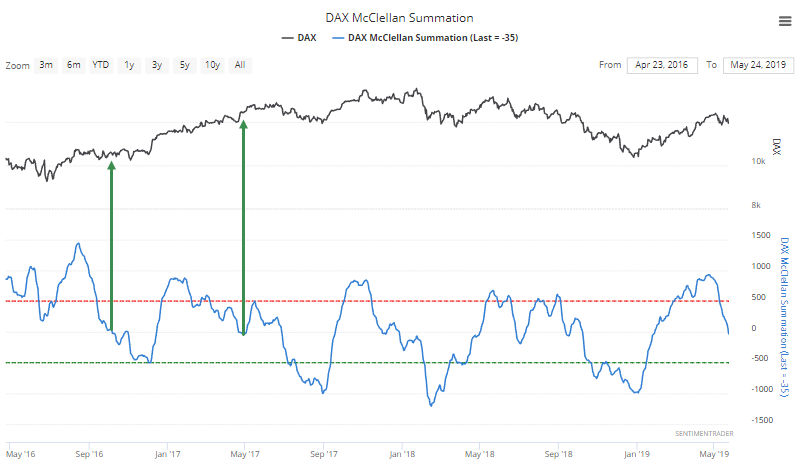
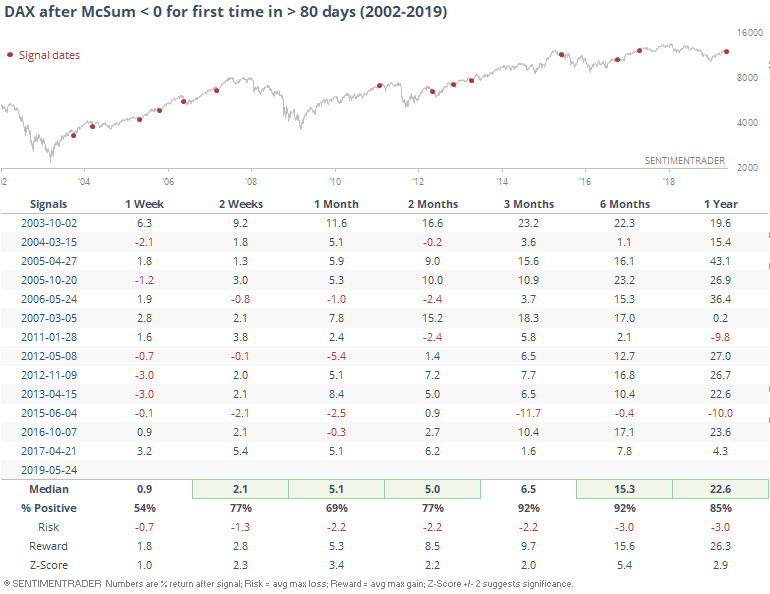
It has tended to react very well over the past 15 years when momentum first turns negative after months being positive.
Long Bonds
As stocks struggle, bonds have rallied and investors have noticed. Clients of JP Morgan are the 2nd-most net long bonds they've been in 7 years. It's an imperfect indicator (it was a terrible contrary indicator during the financial crisis) but does generally skew to the contrary side.
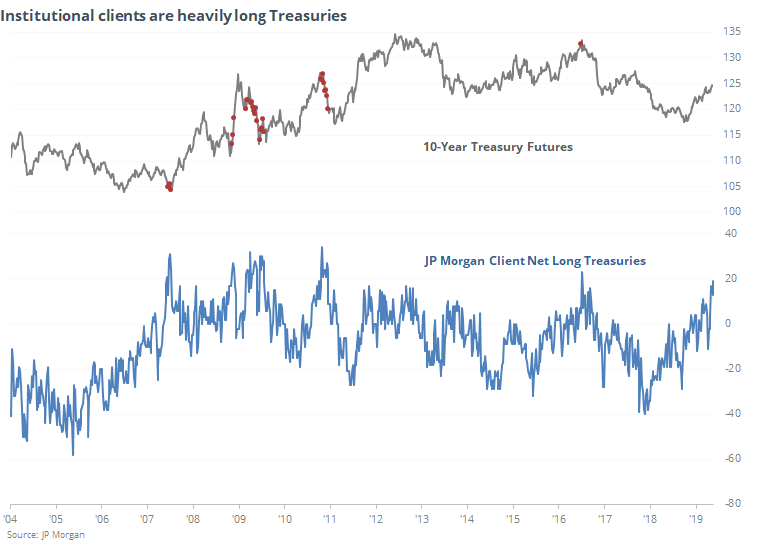
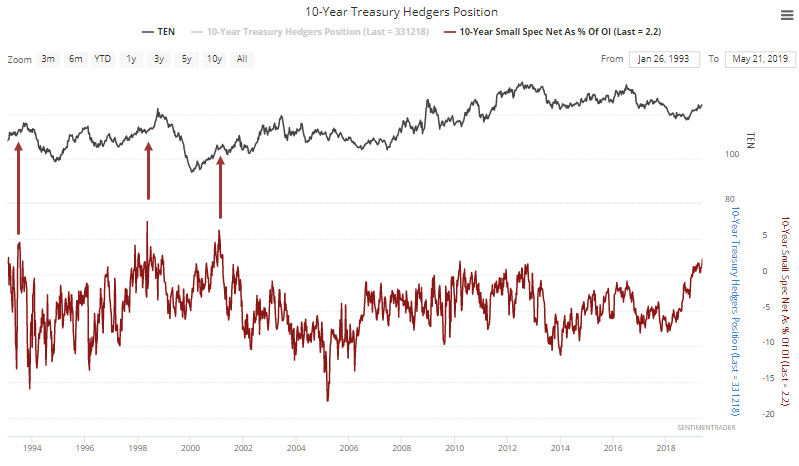
They're not the only ones. While we focus on hedgers and large speculators in the futures market, since they dominate trading volume, small speculators in Treasury futures have quietly been building up their largest exposure to bonds in 17 years.
Improving Overseas
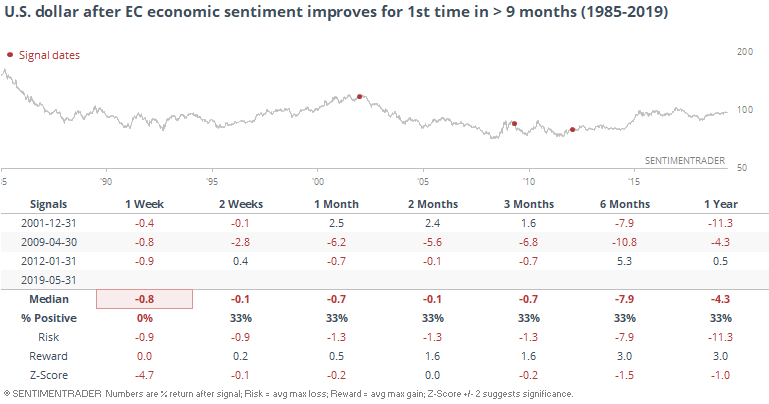
Bloomberg notes that according to the European Commission, economic sentiment has ticked higher for the first time in more than 9 months.
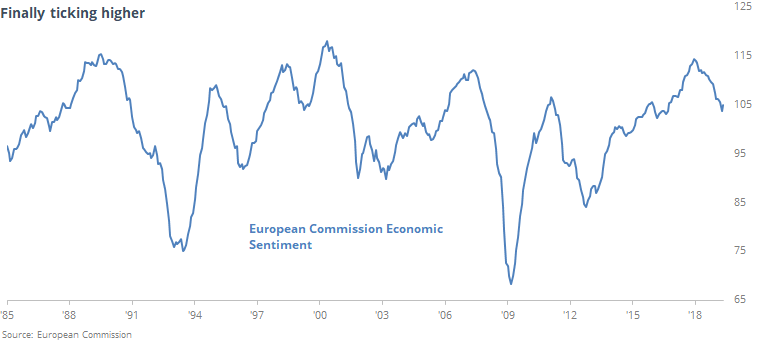
In more than 30 years of history, this ends the 2nd-longest streak of economic pessimism (tied with 2 others). That has been a good sign for the euro.
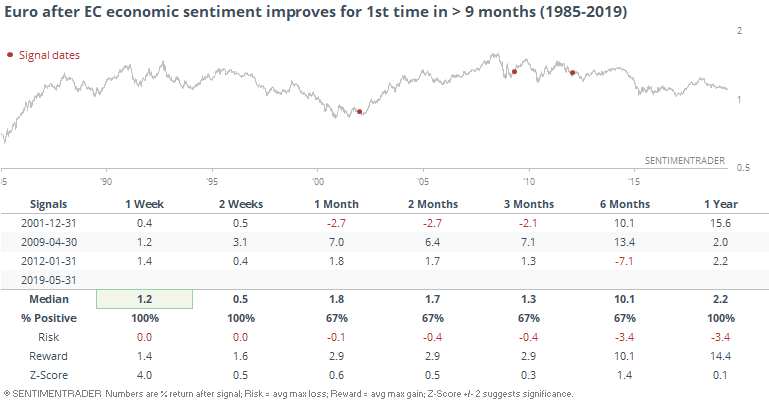
And mostly bad for the buck.
Hedging
We've looked at some indications that anxiety is extremely high lately, like the nearly unprecedented string of large negative opening gaps in the futures market over the past three weeks.
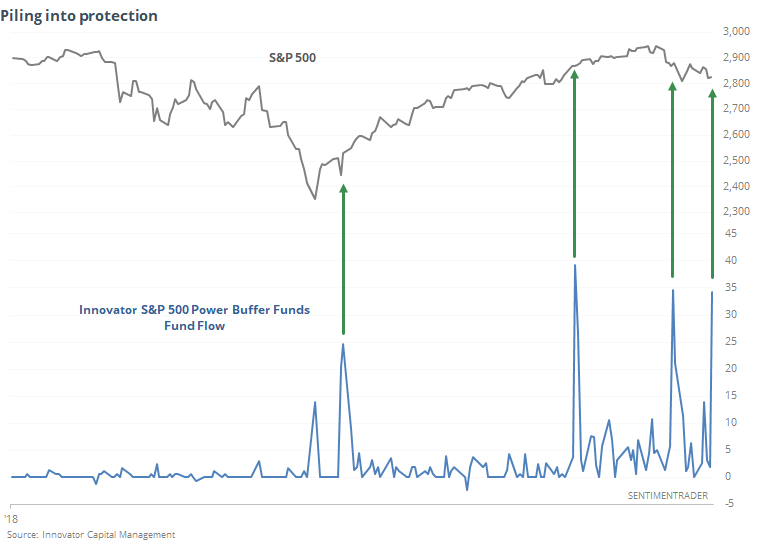
Another, more esoteric one is that traders are moving into ETFs that hedge against a sharp decline in stocks. As the WSJ notes, there has been sudden interest in these expensive funds that are designed to protect against various medium-to-large declines in the S&P 500 over various time periods (both the hedged amount and time frame vary depending on the particular fund).
These are still new, but it looks like it will be an interesting take on sentiment.