Tuesday Midday Color - S&P Recovery, Pound Probabilities, Mixed Breadth

Here's what's piquing my interest so far on a curiously strong day.
Recovery
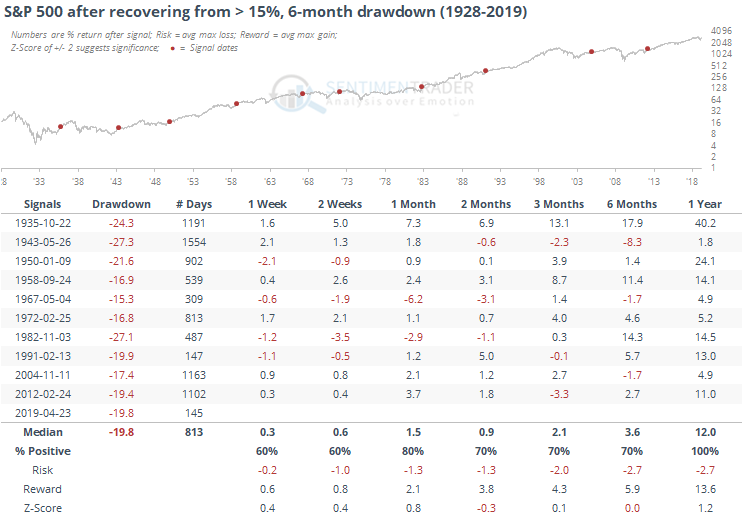
In spite of overwhelmingly optimistic sentiment in some models, buyers continue to persist. For months, the most positive thing about stocks was the price activity (and breadth from December through February), and that hasn't changed.
The S&P 500 is on track to fully recover from its approximately six-month, 20% decline. Other times it did so, future returns were about in line with random, and the risk/reward was unimpressive. The best bet was a year later, when it showed a perfect record of gains, even if they weren't particularly large in most cases.
Pound It
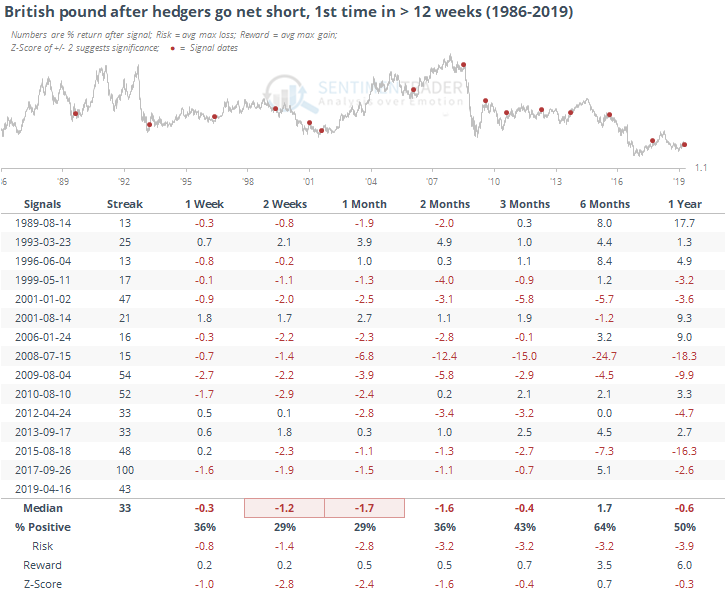
The WSJ notes that speculators have gone net long the British pound for the first time in months. We prefer to track hedgers on the site, since they take the opposite side of both large and small speculators. Regardless, they are opposite sides of the same coin. So this means that hedgers have gone net short for the first time in months, 43 months to be exact.
Hedgers typically go against the trend, because that's their business model, and it's most effective to pay attention when they reach an extreme at either end, which they are not currently at in the pound. It can also be useful to watch when they first become net long/short a contract. If we look at that in the pound, seeing how the currency reacted when hedgers went net short for the first time in at least 3 months, we get the following returns.
Looking at British stocks, here is how the MSCI United Kingdom Index performed.
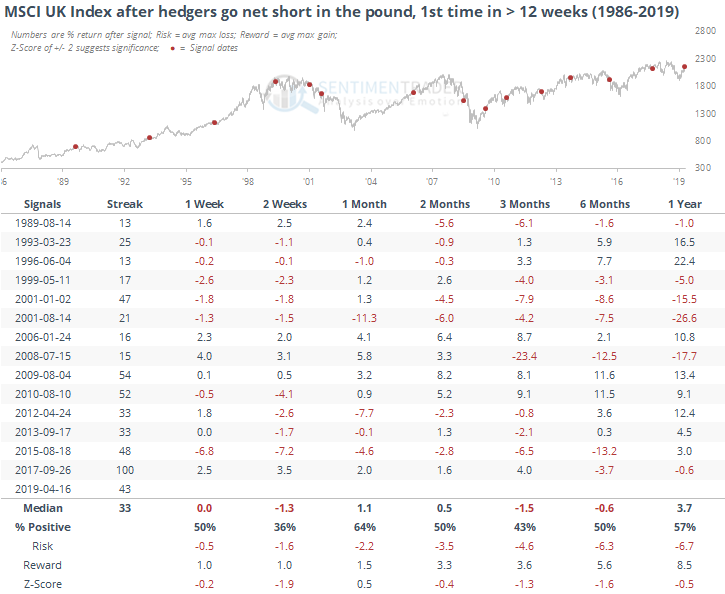
Returns were mostly weak going forward. And that's when it's expressed in pounds. When the index is expressed in dollars, then returns were even worse.
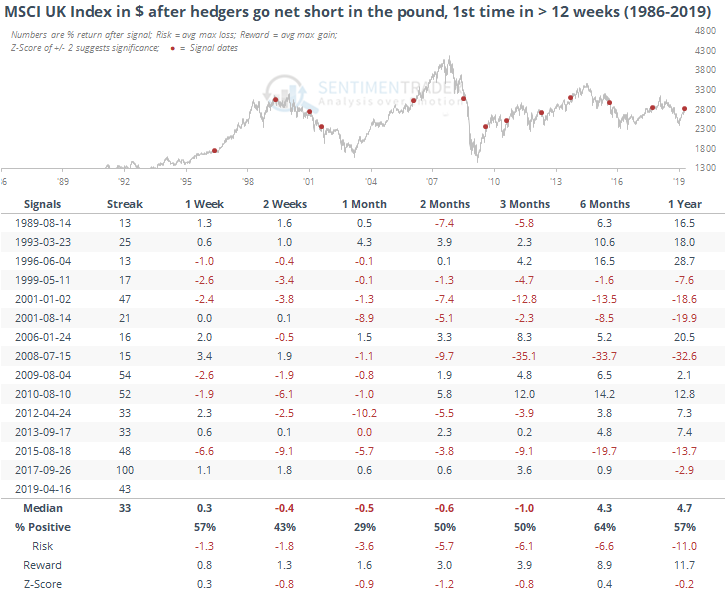
So, the fact that hedgers have gone net short the pound looks to be a headwind for British stocks, especially for U.S.-based unhedged investors, including popular funds like EWU.
Breadth Review
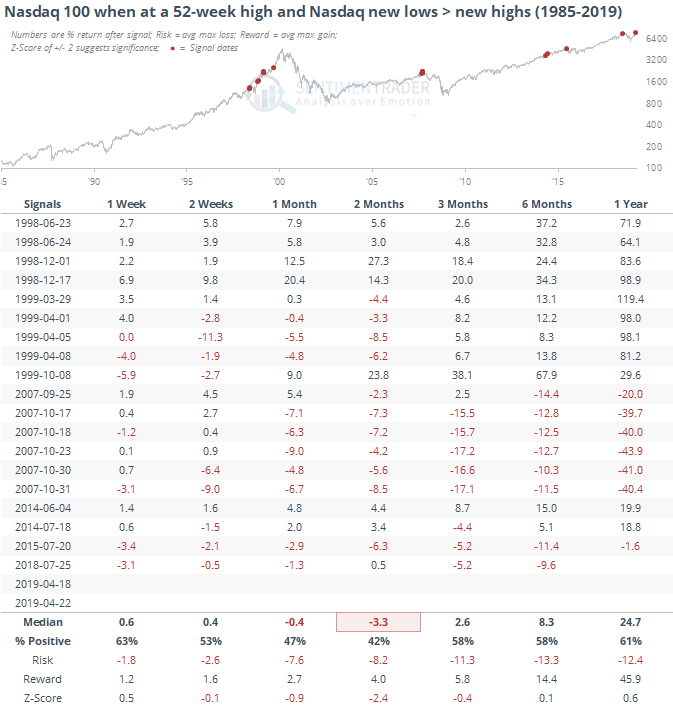
The venerable Helene Meisler has pointed out that despite a new high in the big-cap, tech-heavy Nasdaq 100 index on Monday, there were more 52-week lows than 52-week highs on the Nasdaq exchange.
This does not happen very often, and it hasn't been a great sign.
Within sectors, momentum has been persistent enough that the McClellan Summation Index for staples has climbed to 1500, the highest since 2017. Like most breadth-momentum signals, this has preceded strongly longer-term returns. The medium-term has been shakier, with negative returns most of the time.
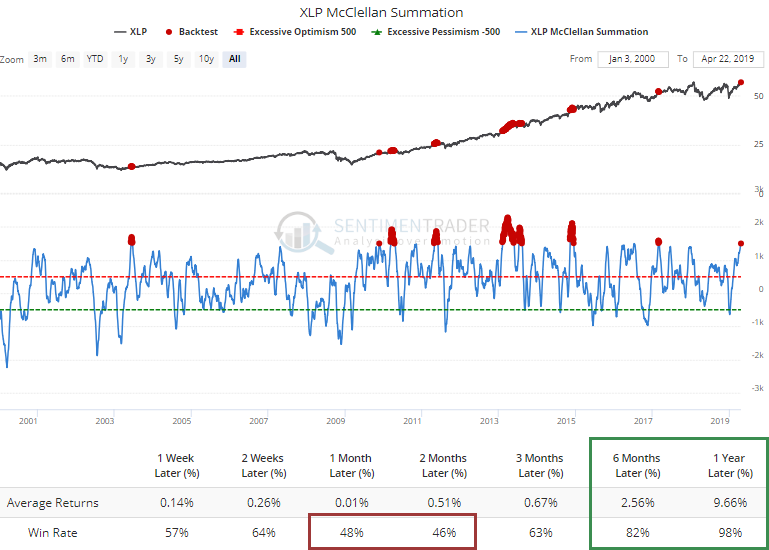
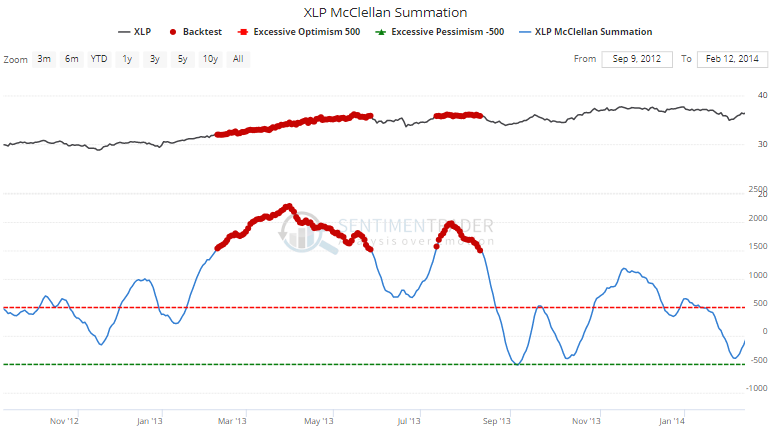
Over the next 1-2 months, even though returns were positive less than half the time, the average was positive. This is due almost exclusively to the momo market of 2013.
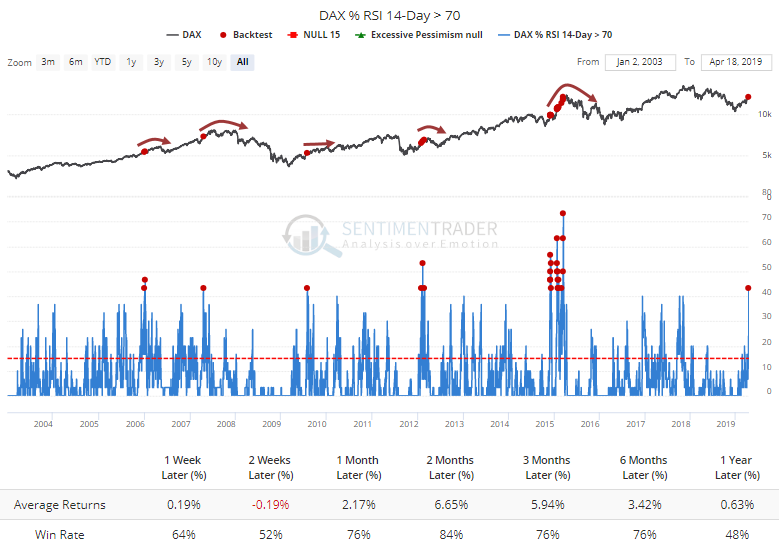
More than 40% of stocks in the German DAX index have now hit overbought levels, the most since 2015. That has preceded a tough slog for further sustained gains. In 2015, they had the most success as the stocks continued to charge higher for a couple of months, but ultimately those gains, too, were reversed.
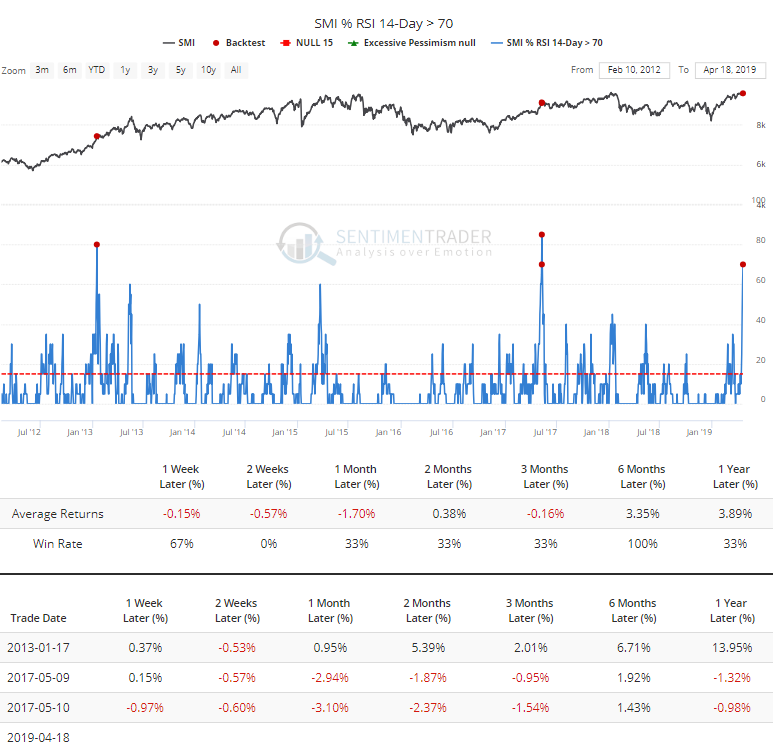
It's even more extreme in the Swiss SMI index, where 70% of stocks are overbought.
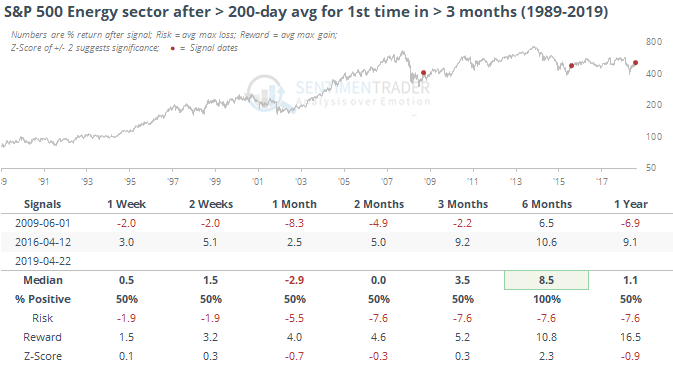
Energetic
A few weeks ago, we saw that when crude oil cycles from well below its 200-day average to above it, the rallies have had a strong tendency to keep going. So far, that's happened, and it's dragging energy stocks along for the ride.
The S&P 500 Energy sector has also now closed above its 200-day average for the first time in six months. When it had been at least 10% below its 200-day average and closed above it for the first time in at least 3 months, future returns were okay, but nothing too special.
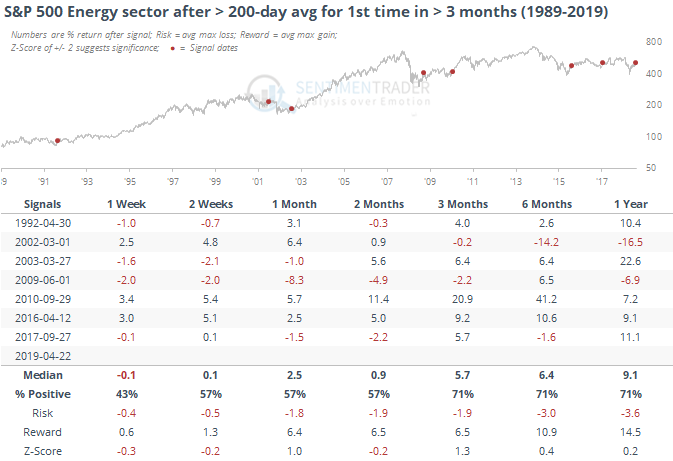
Only twice before had the sector been more than 20% below its average before climbing back above for the first time in months.