
Tuesday Color - VIX below 14, card rates, transport services, slow growth, utility momentum

Here's what's piquing my interest so far today.
Falling Vol
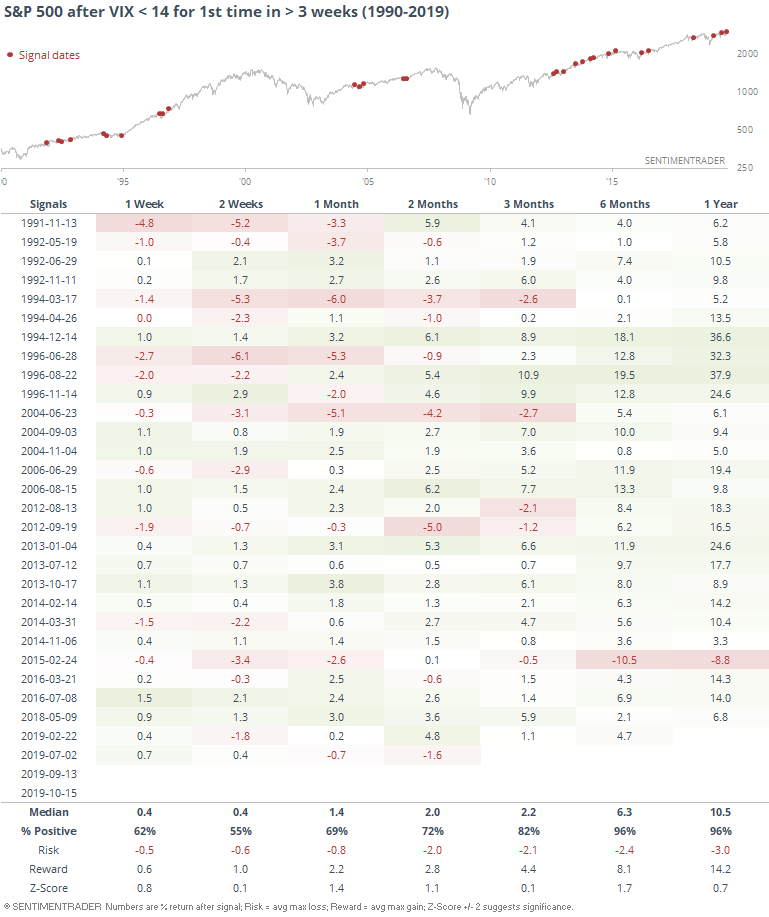
Fear is ebbing a bit, and the VIX is on track to drop below 14 for the first time in weeks. The other times it did so this year, stocks rallied further 2 out of the 3 times.
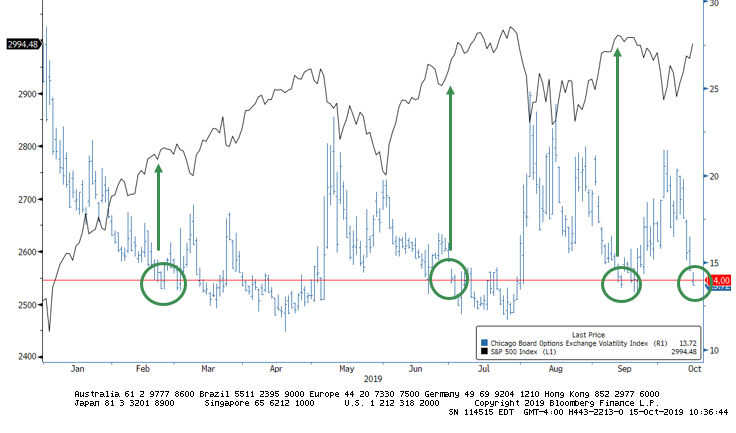
Historically, it has been more of a positive than a negative. It's not so low that it has proven to be a sign of complacency. Only 1 of the signals preceded a loss over the next 6-12 months.
Doomsday Preppers
Credit card companies keep raising the rates they charge on consumer balances, despite relatively low (and declining) short-term interest rates. According to the WSJ, this isn't necessarily just a money grab, it's an indicator that the big card companies could be preparing for a wave of charge-offs during the next downtrend.
Looking at the spread between the average rate charged on credit cards in the U.S. and the yield on 90-day T-bills, we just exceeded the prior record from 2009.
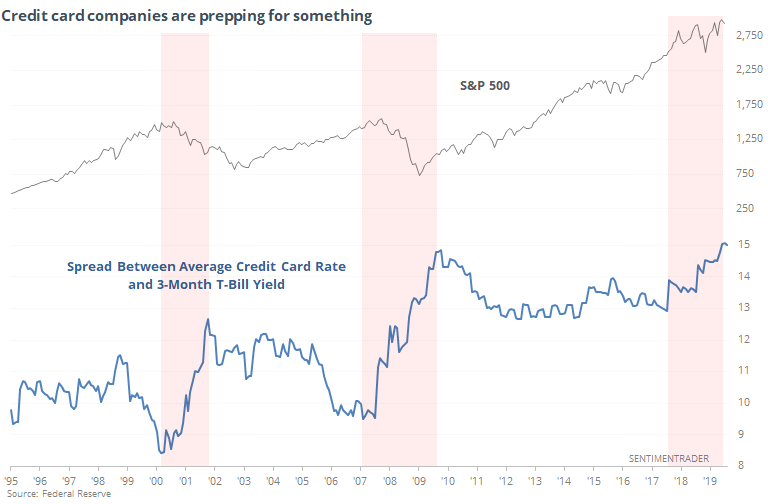
It's interesting to note that this spread widened dramatically during the last two bear markets. It's been climbing since the middle of 2017 in this cycle, so far without the disastrous declines in stocks the last two times.
I suppose this could be taken two ways - stock investors are just ignoring the implications of a looming crunch, or the big card companies have overstated their probabilities of a sustained slowdown. With a sample size of 2, it's impossible to judge the probability of which side is likely correct, but it does seem to be a disturbing trend.
Trucking Along
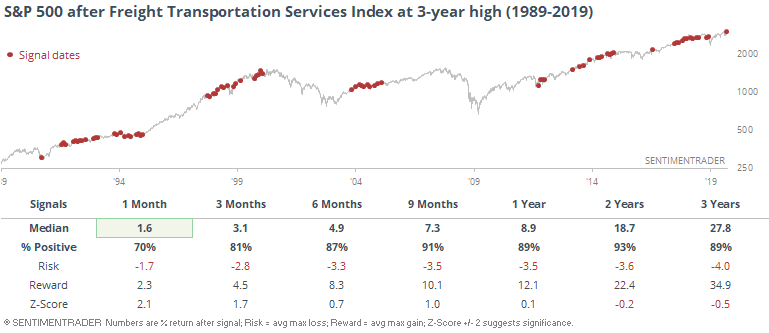
Marketwatch notes that while price-based indexes like the Dow Transports might be struggling - and throwing off a potential warning for Dow Theory aficionados - there are better measures for the health of that part of the economy. Like the Freight Transportation Services Index, which is sitting at a new high.
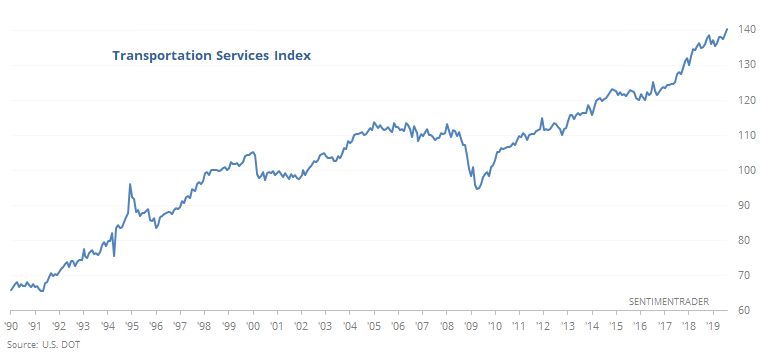
Indeed, future returns in the S&P 500 when that index hits a 3-year high have been better than average (there were 77 months that qualified). There is a long delay in the data, so we're using a longer time frame in the forward-return table.
The Dow Transports haven't been buying into that scenario, though. At the end of August (the latest data available), the Transports were more than 10% off their own high. For the market as a whole, this was *not bearish*.
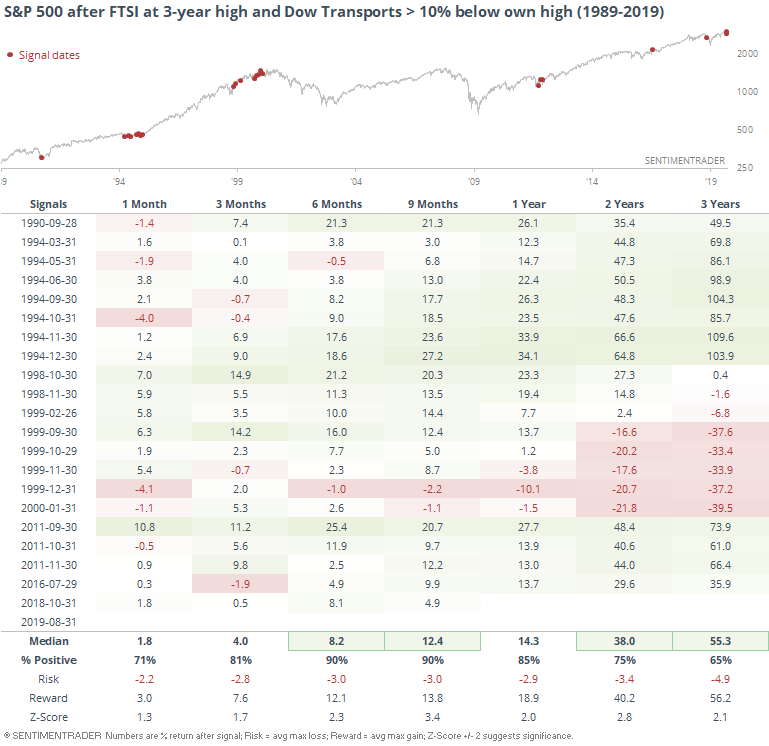
It did trigger near the market peak in 2000, but other than that, suggested that investors in transportation stocks had been too pessimistic, given some of the underlying strength in the sector.
Slow Going
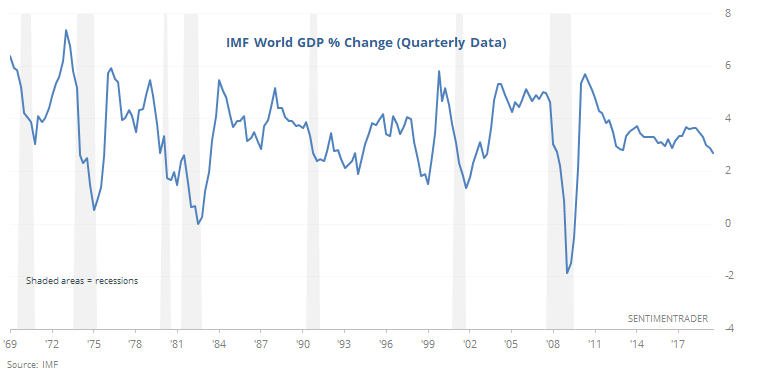
According to the latest IMF estimates, global GDP growth in 2019 is slated to be around 3%, give or take. The part that will generate media headlines, though is that that's the slowest growth rate since the financial crisis.
There is so much guesswork, revisions, and delays in this data that it's impossible to use as any kind of input for a forecast for stock returns. But just for fun, here are the returns in the S&P 500 after global growth first hit a 5-year low.
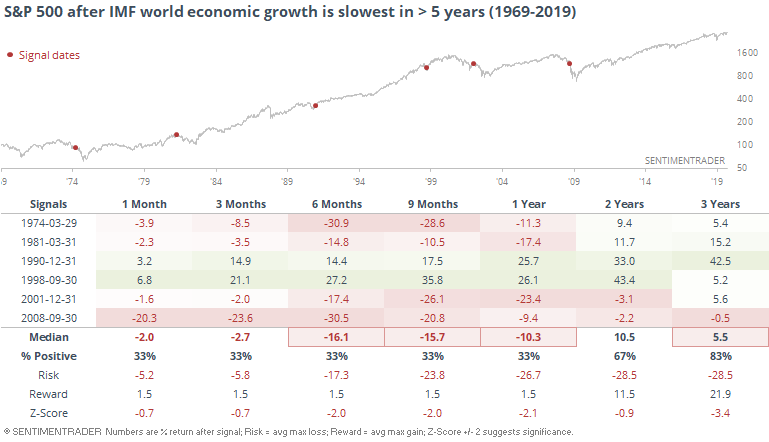
Again, these could not have been used in real-time, so it's only a mental exercise. Of the 6 instances, 4 led to large declines, 2 led to large rallies, so an edge to the bearish side there.
The problem is that we have no idea if this will come to pass, since they revise the figures so often and by the time we know the official tally, it's way too late. Taking it at face value, though, it is a bit disturbing, especially when we look at some of the other economic and earnings data coming out lately.
Sector Breadth
We'd seen that the big buying interest in utilities a couple of weeks ago has a strong tendency to lead to weakness in the weeks ahead. The sector hasn't performed all that badly since, but has been weak and the stocks just closed at their lowest level in a month. That has pushed the McClellan Oscillator to one of its lowest levels in a year.
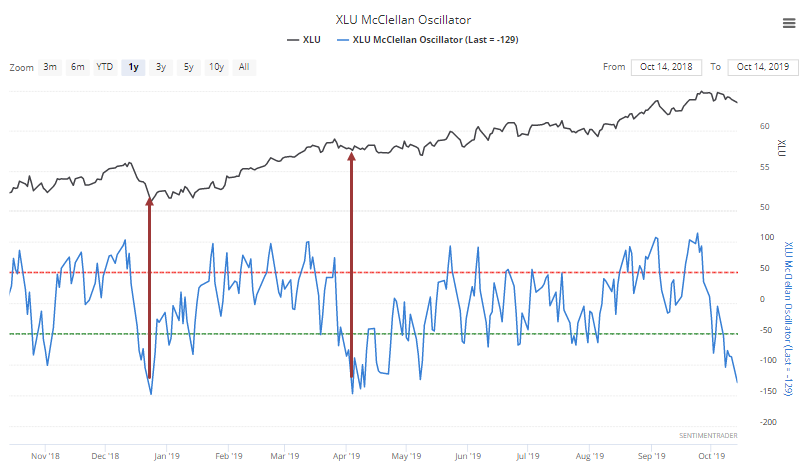
When it got this low last December, the stocks bottomed. Earlier this spring, there was some more selling to come in the weeks ahead. Longer-term, that has been more the rule than the exception. The Backtest Engine shows that shorter-term returns were relatively weak when the Oscillator first dropped below -125 while XLU was still above its 200-day average.
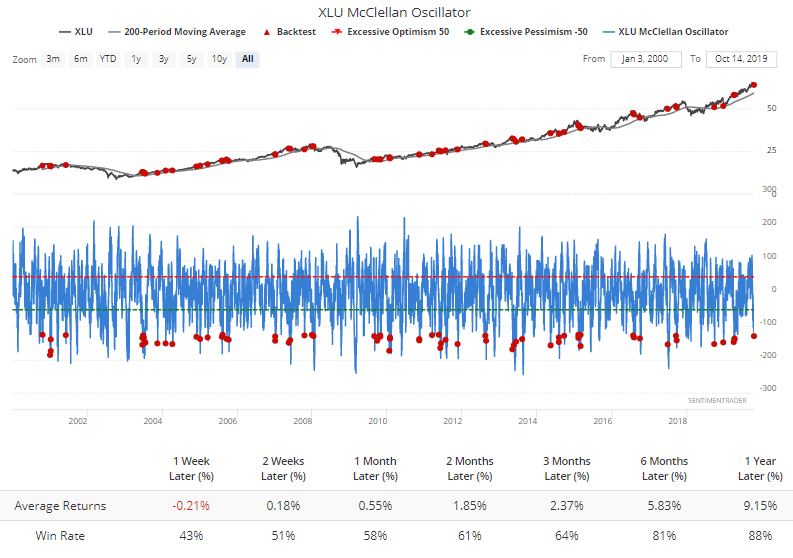
Longer-term returns were good, but there isn't much here that suggests the very low Oscillator reading is a good buy signal just yet.