
Tuesday Color - Overseas Rebound, Sector Recoveries, HY vs IG Spreads, VIX Drop

Here's what's piquing my interest as stocks gyrate in what is likely going to be a pattern of low (and lower) volume in the days ahead.
Overseas Rebound
In the Hang Seng index of Hong Kong stocks, 90% of them have jumped enough to trade above the 10-day averages. That has preceded some short-term exhaustion lately.
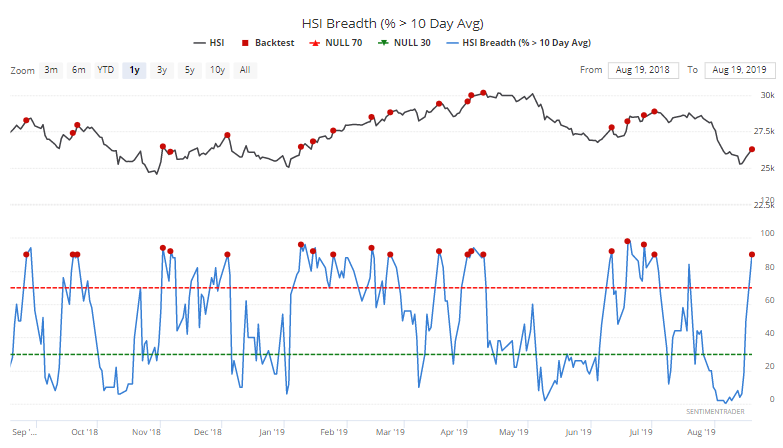
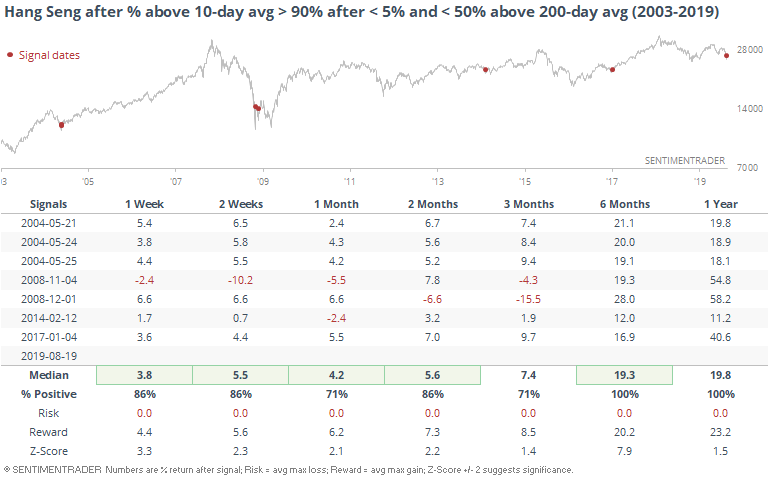
But it's worth noting the context. That figure was under 5% within the past week, and more than half the stocks are still trading below their 200-day averages. This suggests a short-term thrust within a longer-term downtrend.
When this happened before, it indicated the early stages of longer-term recoveries.
There has been a similar, though less dramatic, recovery on the Shanghai.
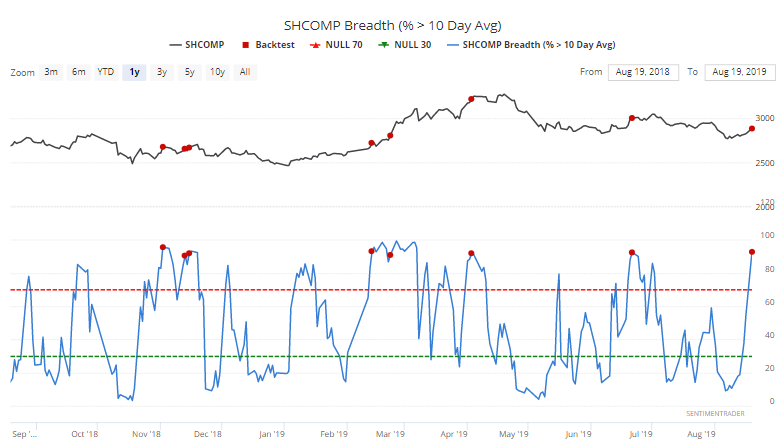
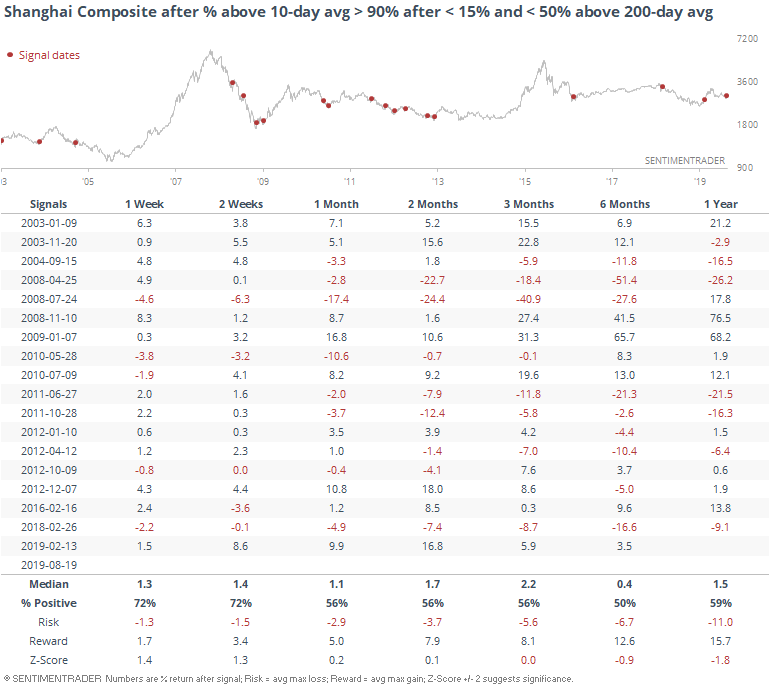
Its results have been less impressive. Like we've often seen, the Shanghai trades differently than just about any other major index in the world. It doesn't obey the same kinds of behavioral norms.
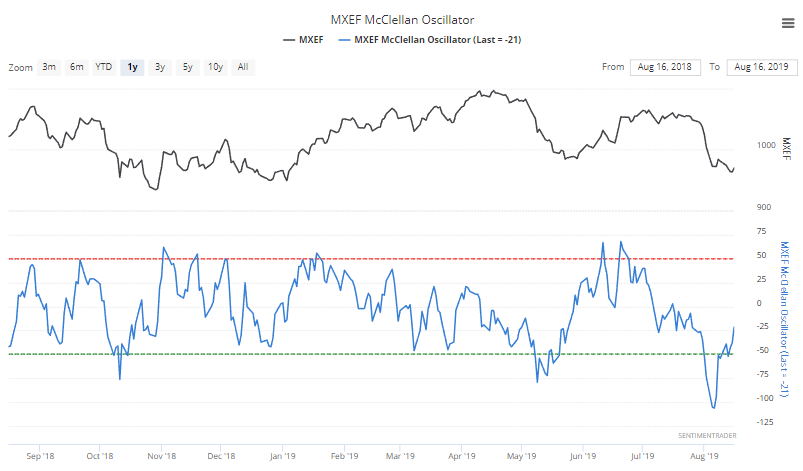
Emerging markets are trying to recover as well, after the McClellan Oscillator dropped to a record low a couple of weeks ago. It's still not above the zero line, however.
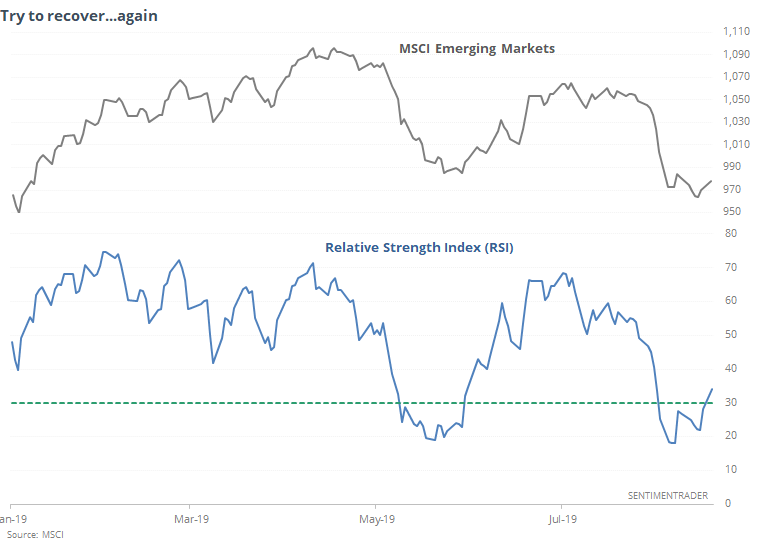
Technically, the index is emerging from an oversold condition, with the RSI for the MSCI Emerging Markets Index rising above 30 for the first time in weeks, after dropping below 20.
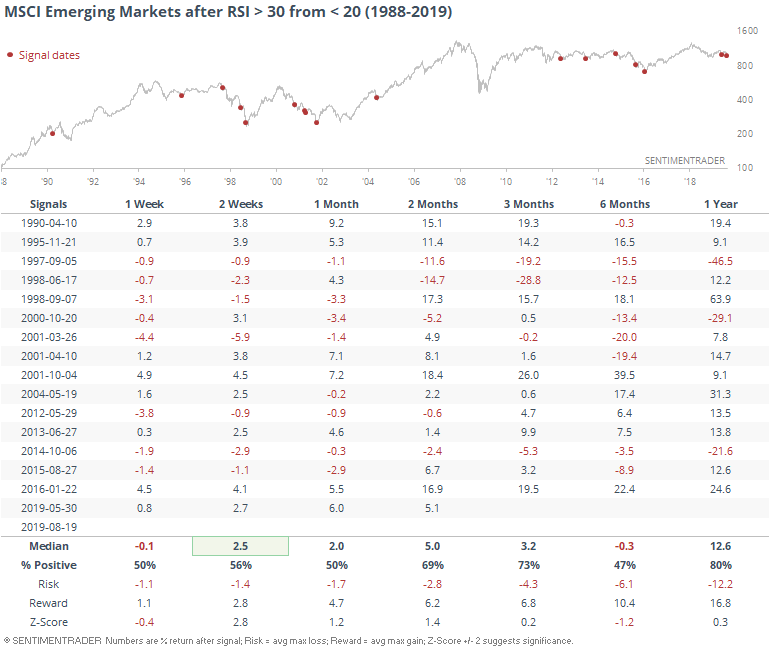
The folks at Daily Wealth note that this has been a positive for the EEM fund in recent years. Longer-term, the record is more mixed. A year later the index was higher all but three times...but those three losses were all larger than -20%.
U.S. Sectors
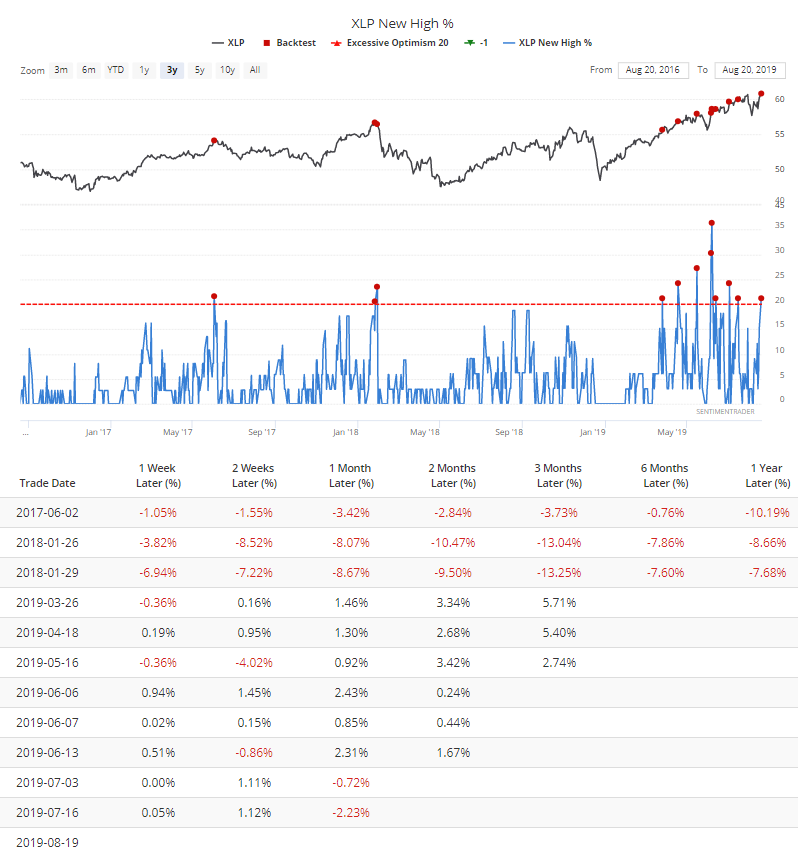
Among U.S. sectors, the preference for defensive stocks pushed more than 20% of consumer staples to new 52-week highs. While that hasn't been a signal of exhaustion, returns up to the next three months were well below random.
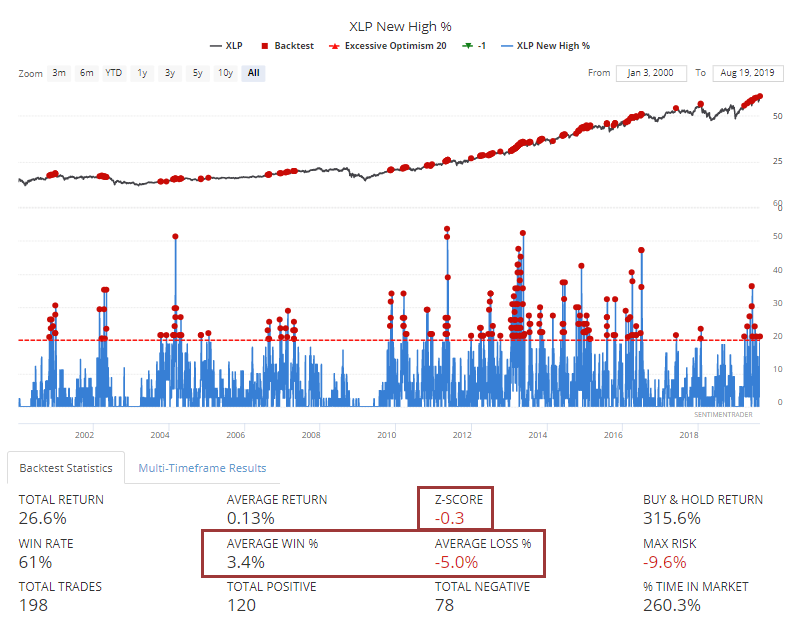
Over the past few years, only the reading in April of this year led to meaningful sustained gains. Otherwise staples' returns up to the next month tended to be either negative or barely positive.
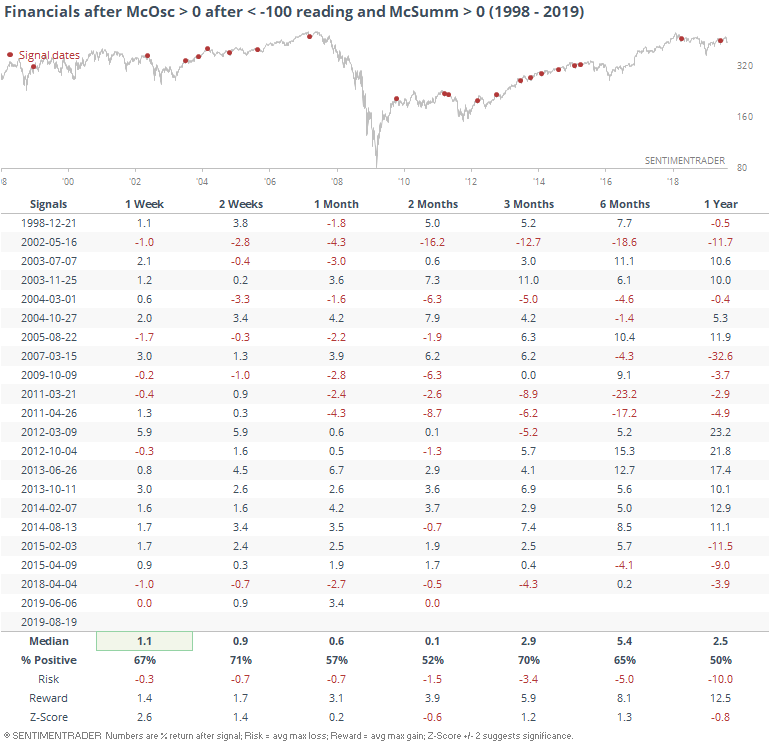
Financials are trying to reverse what had been some negative momentum underlying the sector. The McClellan Oscillator has turned positive after more than two weeks in negative territory, including a reading below -100, even while longer-term momentum was positive with the Summation Index well above zero.
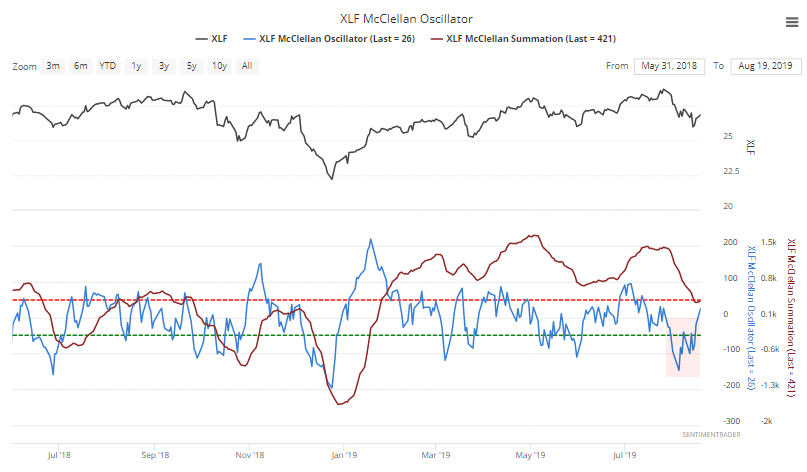
This was mostly a great all-clear sign from 2013-2015, but not so much otherwise. Need to watch this in case the Oscillator dives back below zero, which would not be good.
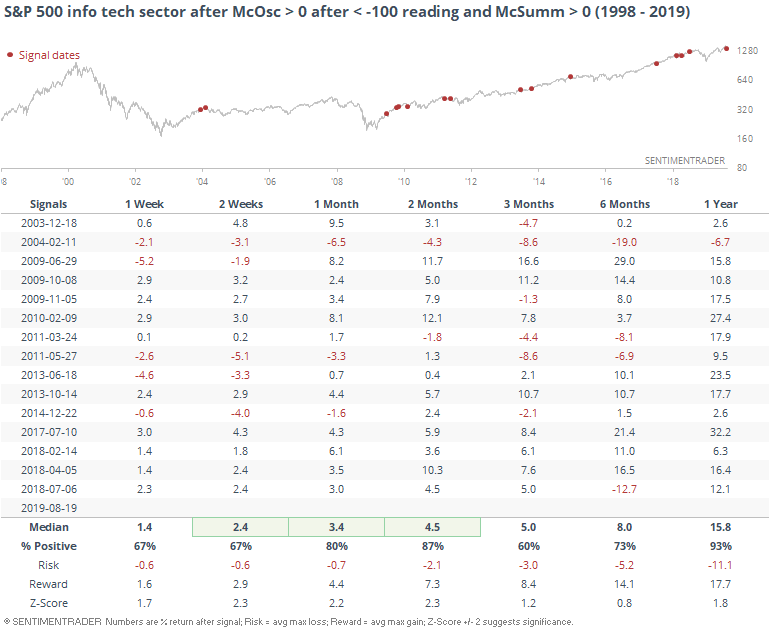
The same thing is happening in tech stocks.
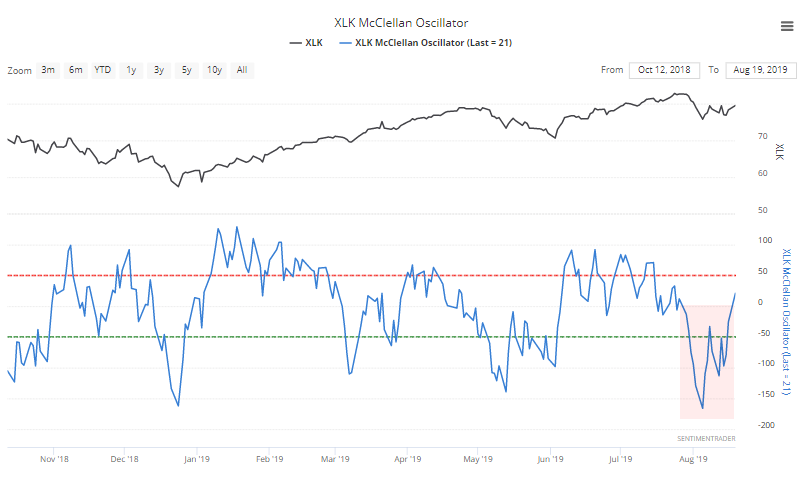
This has been a much better sign.
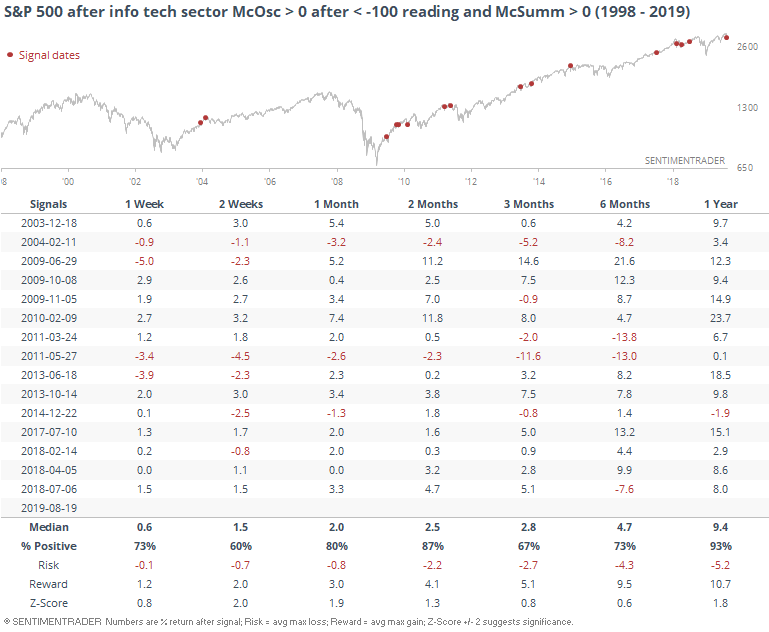
Mostly a good sign for the broader S&P 500 index, as well. A year later, only one small loss.
Spread Blowout
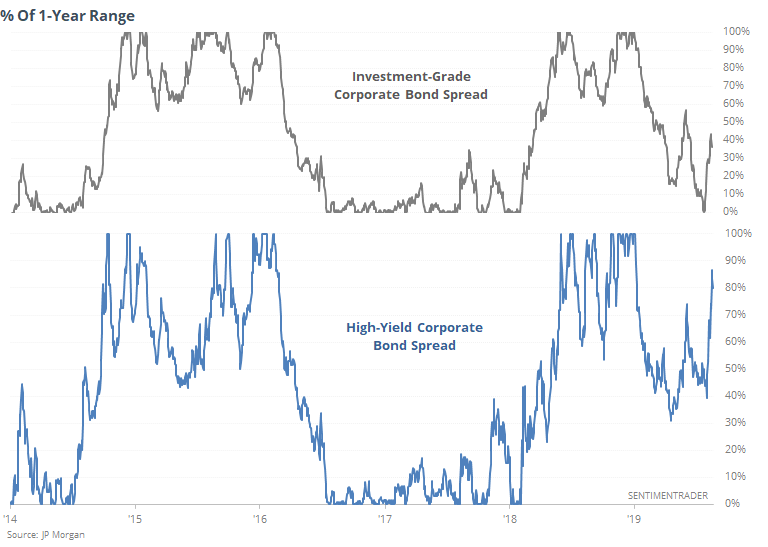
The WSJ notes that high-yield bonds have been greatly underperforming investment-grade ones relative to Treasuries. This is often taken as a caution sign that some of the most economically-sensitive investors in the market (in high-yield bonds) are pulling back on their risk exposure.
That has been the case, as investment-grade bond spreads are in the bottom 40% of the range they've been in for the past year, while high-yield spreads are in the upper 80% of their range.
The argument that this is a major worry for stocks seems sound, as bond investors are usually considered the "smart money." But if we look at other times this has happened - when the spread in the 1-year range between the two has blown out like it has recently - it's not conclusive.
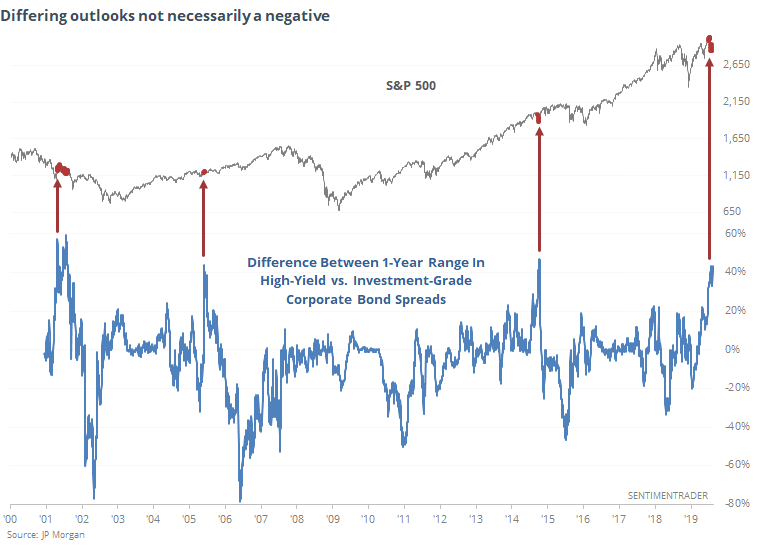
These investors were sounding early alarms during the 2001 recession, so a point in their favor. They were "early" if we want to call it that in 2005, and stocks did great for 2 more years. In 2014, stocks continued to rise for months, before ultimately rolling over. Whether to call that a success or failure is up for interpretation.
Overall? Doesn't seem like an imminent and consistent reason to worry.
Returning To Normal
Bloomberg notes that traders' anxiety levels are starting to calm, with the VIX "fear gauge" falling back below its 20-day average.
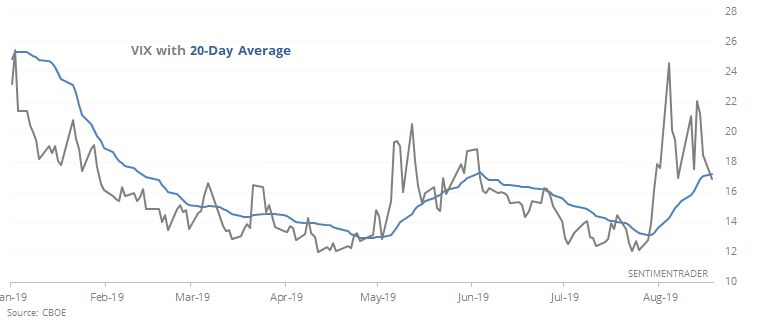
Opportunistic traders often like to buy when the VIX first spikes, with the knowledge that extreme can always get more extreme. More conservative ones prefer to wait until things show some sign of settling back, like now.
For the most part, this wasn't a bad strategy. When the VIX first fell back below its 20-day average for the first time in weeks, and it hadn't been above 25 for at least the past couple of weeks, stocks typically rose afterward.
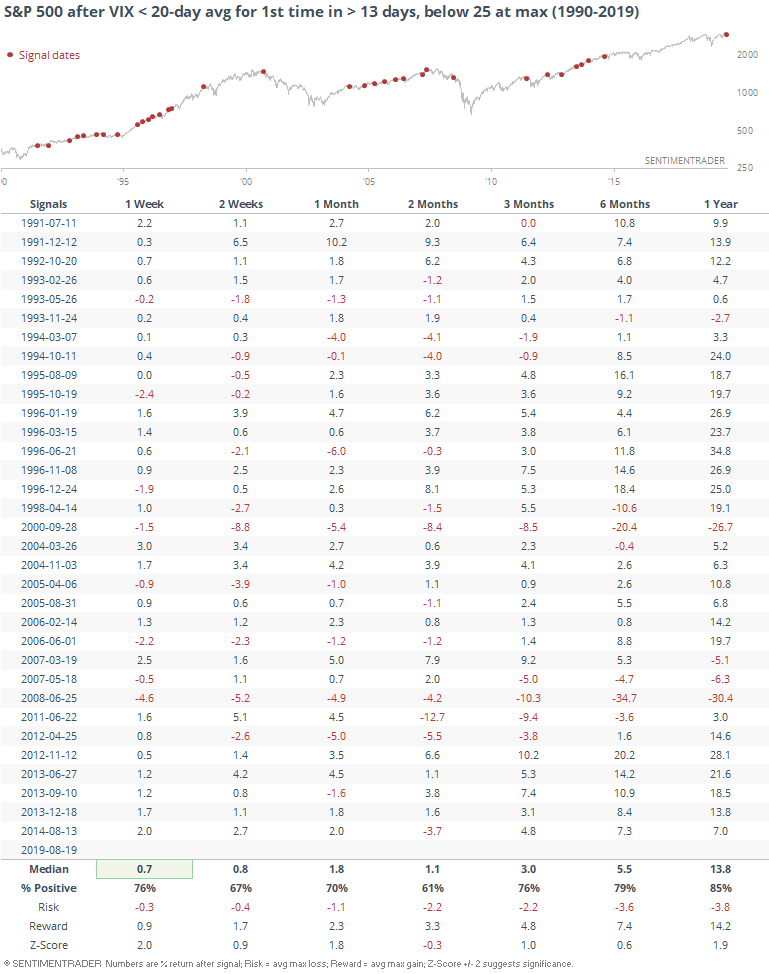
Of the 33 signals, the S&P lost more than -5% at some point over the next 3 months 7 times, while gaining more than +5% at some point 16 times, so a decent risk/reward setup.