Tuesday Color - High Yield Rally, Sector Breadth, Recession Risk, Yield Drop

Here's what's piquing my interest on another day showing a recovery from early weakness.
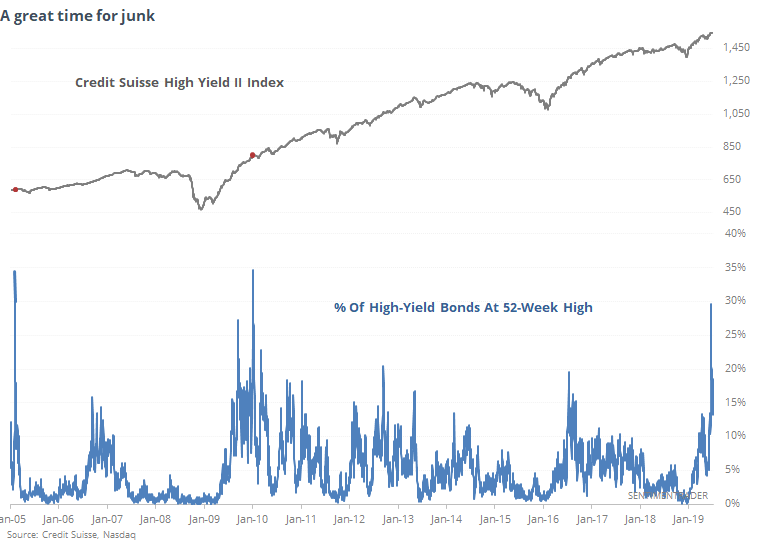
High Times For Junk
Over the past couple of weeks, the high-yield (junk) bond market has enjoyed one of its best stretches in at least 14 years. Nearly 30% of the 2,000+ bonds tracked by the Nasdaq hit a 52-week high, approaching the most since at least 2005. The Credit Suisse index has a very high positive correlation to popular ETFs like HYG and JNK.
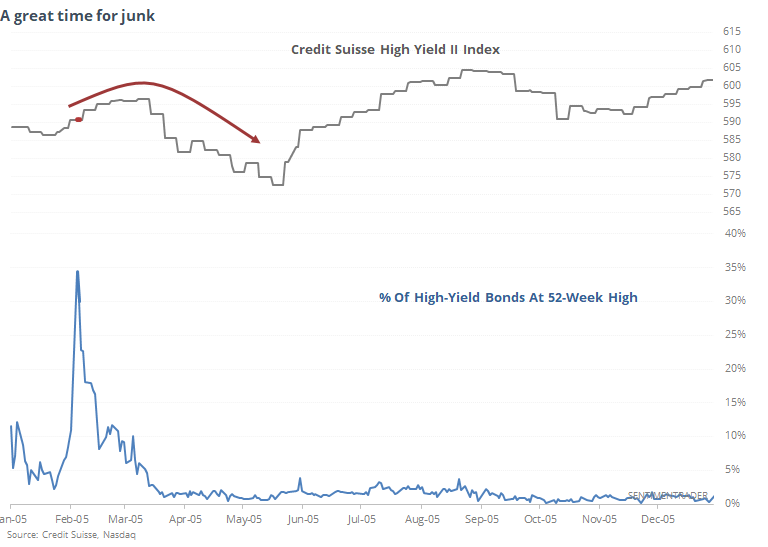
Let's zoom in on each of those instances. In 2005, the bonds continued to trade higher for a few weeks, then topped out and suffered a multi-month pullback
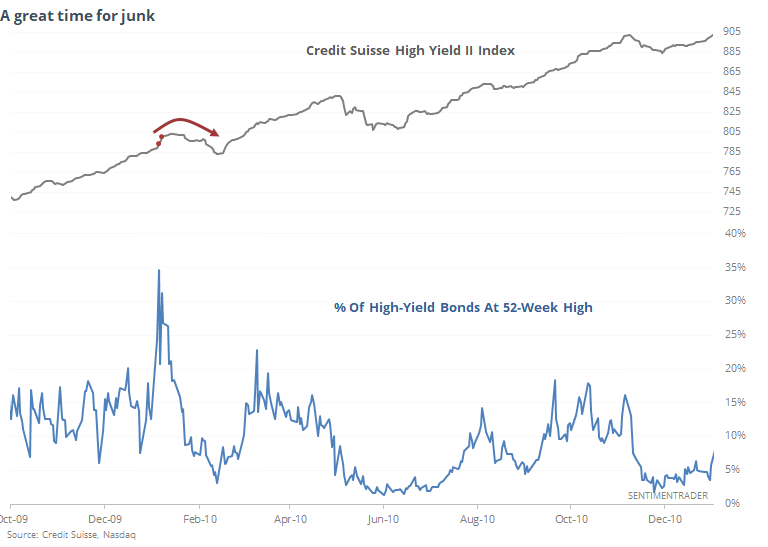
It wasn't that much different following the early 2010 instance, with the market soon peaking and falling into a multi-month pullback before surging again to new, and sustained, highs.
It's remarkable that we're seeing this kind of activity now, with the only real precedent for this many 52-week highs among junk bonds, over this long of a period, being the initial kick-off to the recovery following the financial crisis.
While there is a good probability that this shows "too much, too fast" behavior and the likelihood of a shorter-term relief from incessant buying pressure, longer-term it looks to be a good sign.
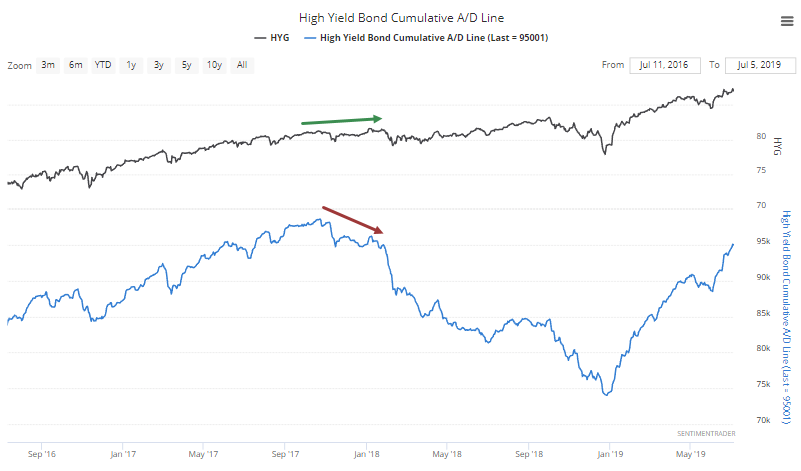
Especially since there is no sign yet of diverging fortunes underlying that market. There has been no negative divergence in the Cumulative Advance/Decline Line for high-yield bonds. It's not necessary to see one before a peak, but it is a good sign that something is wrong when it does trigger, like early 2018.
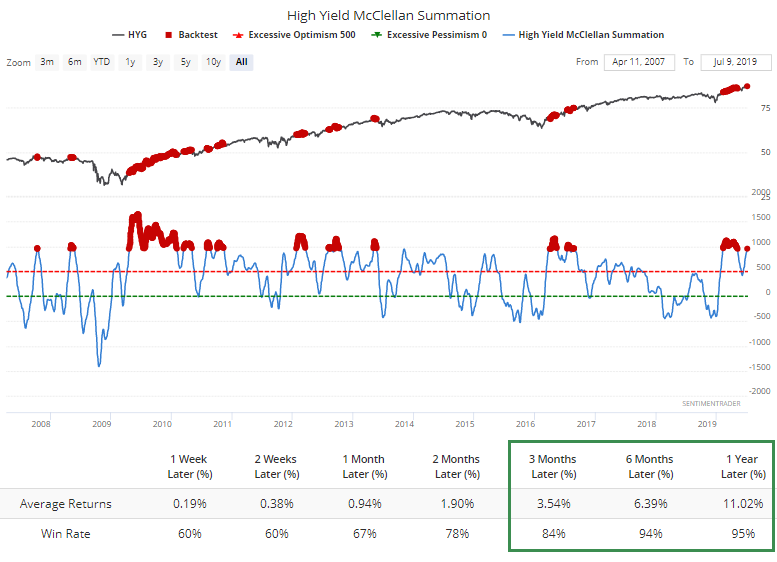
The persistently positive breadth has pushed the McClellan Summation Index for the high-yield bond market close to +1,000. Shorter-term returns were flatish when it got this high, but longer-term returns were very good.
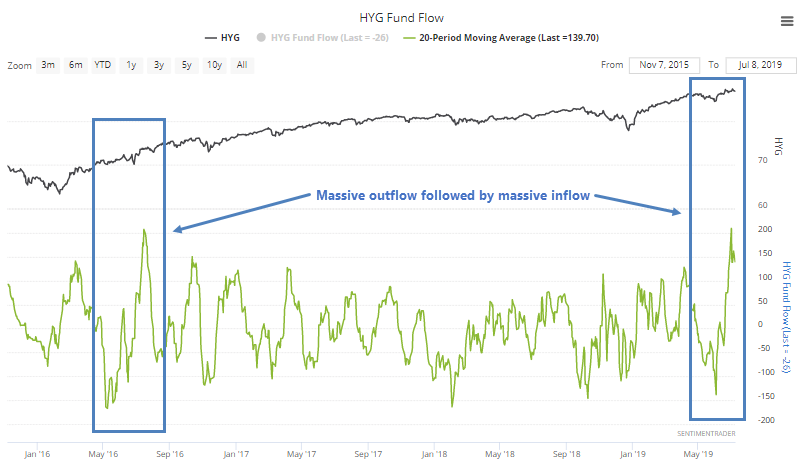
The new highs have attracted ETF investors, who have switched from a heavy outflow in funds like HYG to heavy inflow. The only time we've seen it to this degree was in the summer of 2016. The big inflow led to some short-term chop, but that was about it.
Sector Breadth
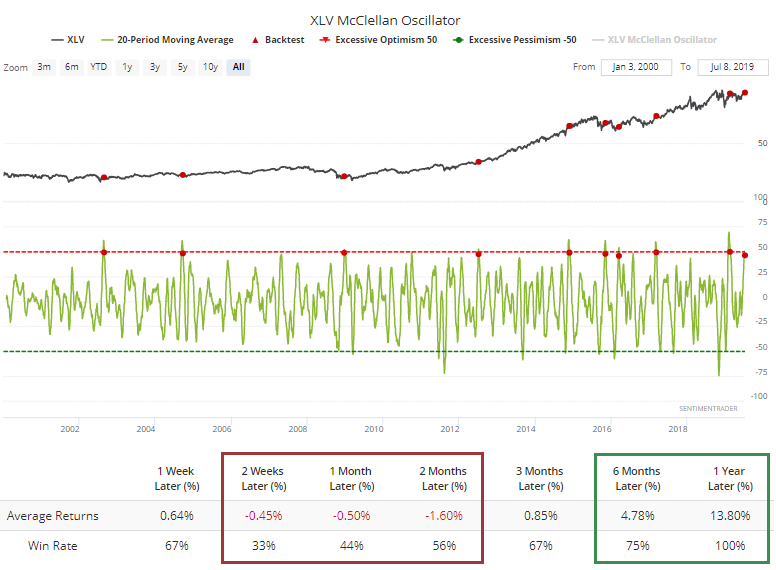
There weren't too many changes underlying most of the sectors and indexes on Monday. Among the most notable developments was that the McClellan Oscillator for health care stocks has started to roll over from a very high level.
As is typical with this kind of setup, shorter-term returns were poor after similar setups, but longer-term returns were good (due to the momentum evident by such a sustained high Oscillator).
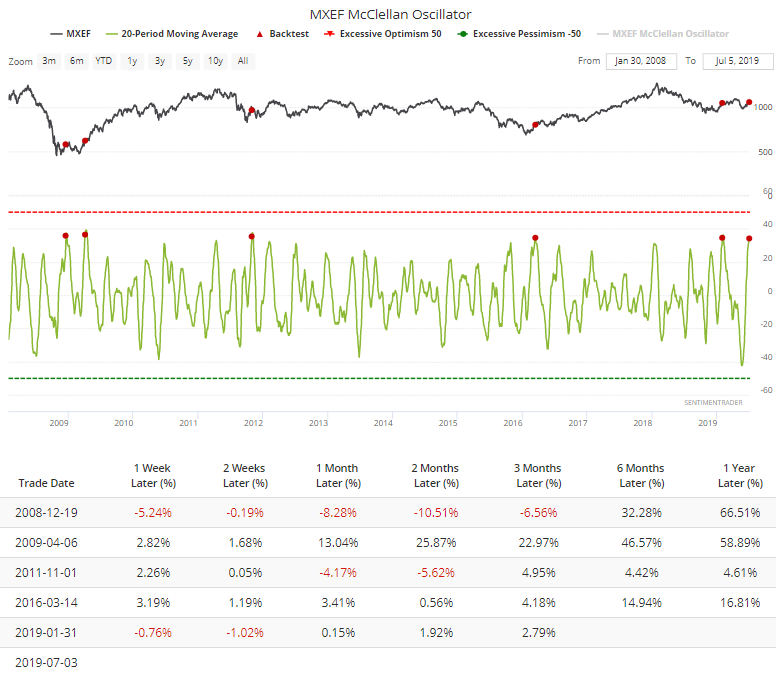
The Oscillator also hit a very high level over a 20-day period in emerging markets. Over the 5 other times this triggered, all but one saw negative or flat returns over the next 2-8 weeks, that exception being the emergence from the financial crisis.
Rising Recession Risk
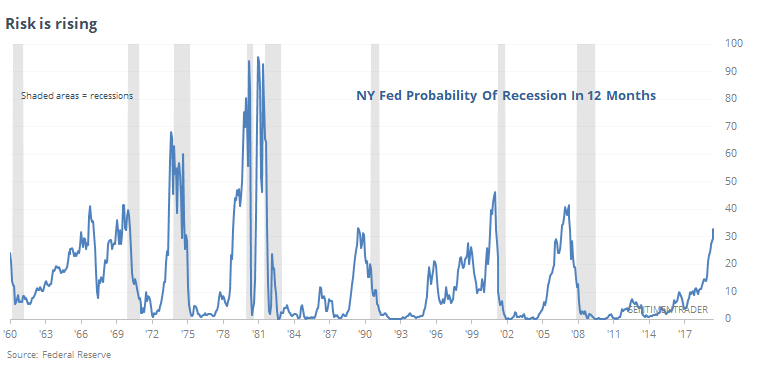
The NY Fed model of the probability of the U.S. falling into recession within the next year has gotten a lot of attention again. It's based on the yield curve, and because of its sustained inversion (or close to it depending on the maturities), the model's risk is rising.
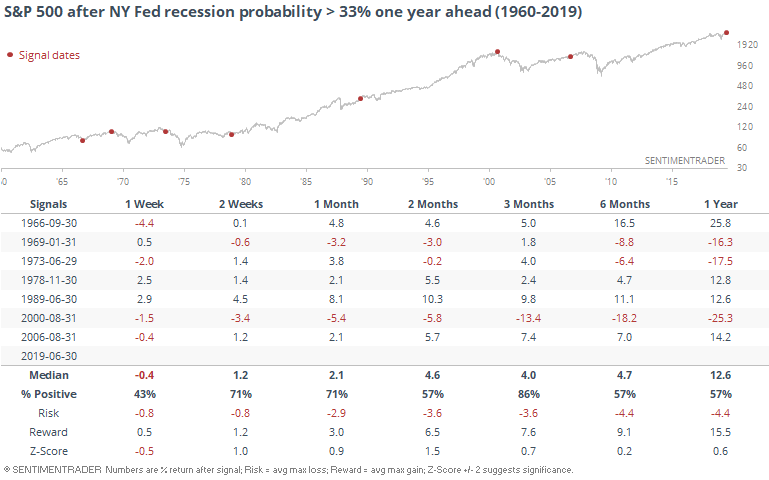
It guesstimates the risk of recession one year in the future, so we have to use dates one year prior to the model's date in order to look at real-time results.
For stocks, it wasn't an imminent warning sign. Three months later, the S&P 500 was higher every time but once...though that "once" was painful.
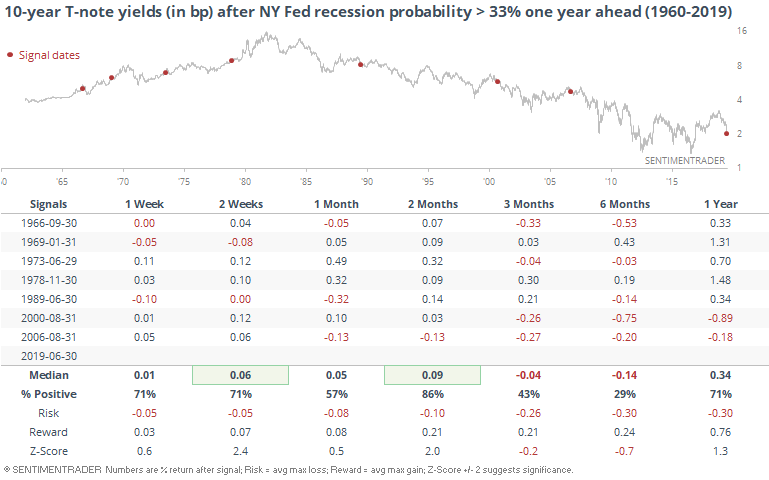
At the same time, 10-year Treasury note yield tended to rise over the next couple of months, then decline over the next 3-6 months.
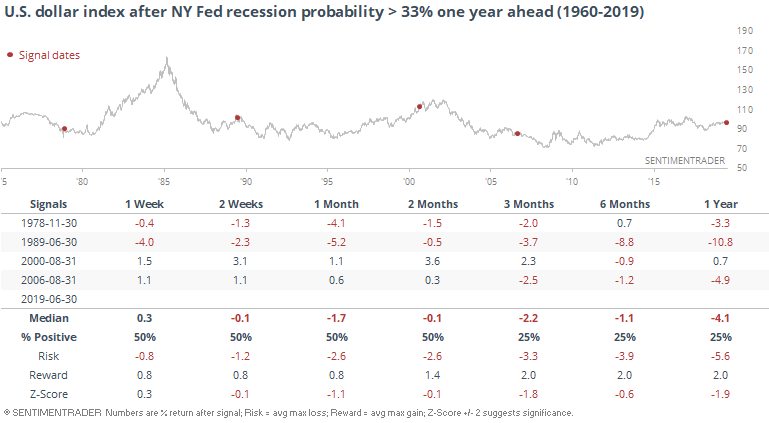
It wasn't a great sign for the dollar.
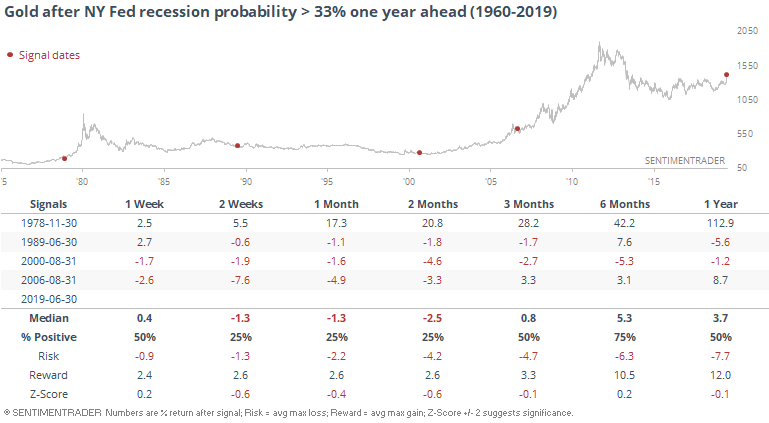
It was better, after a while, for gold.
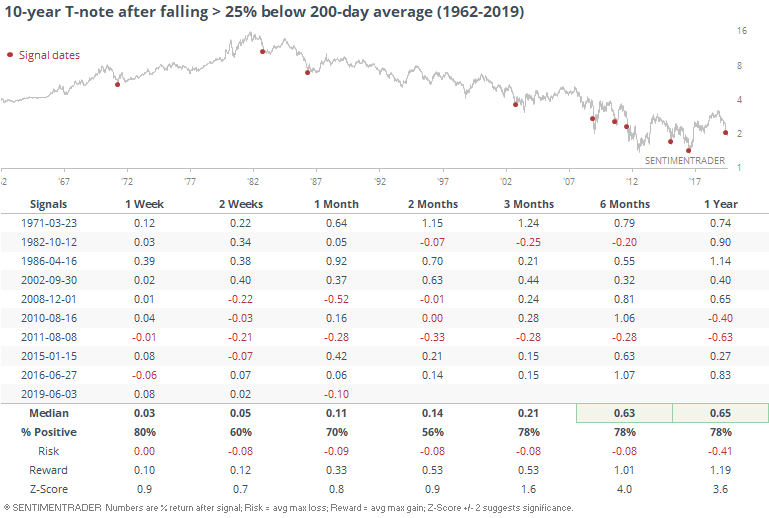
Stretched
SunTrust, via the WSJ, notes that the yield on 10-year Treasuries has deviated significantly from trend. It has collapsed to more than 25% below its 200-day average.
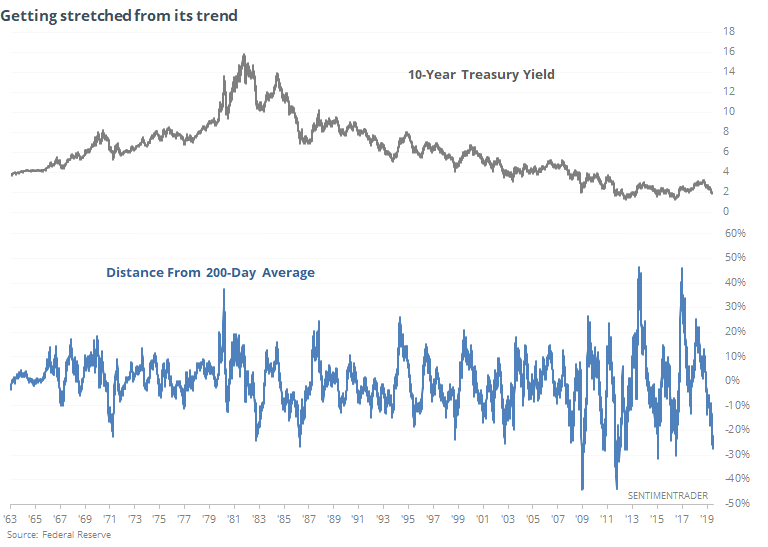
It didn't *quite* become this stretched in 1971 and 1982, but we're going to call it close enough and include them in the sample. By the time yields fall this much from trend, they have tended to snap back.