
Trend-following: the good, the bad and the biggest obstacle

Key points
- Trend-following is one of the oldest investment strategies
- A properly executed trend-following strategy can produce above-average profits over time
- As with most all investment strategies, discipline is the key to successfully utilizing a trend-following approach
The overview
This piece will test one specific trend-following strategy using weekly closing price data for the S&P 500 Index starting in 1920. As you will see, the strategy has outperformed buy-and-hold over 100+ years. Nevertheless, it is not necessarily a recommended strategy. It should be thought of as more of an illustration.
A trend-following strategy does not attempt to pick tops or bottoms in the market. The goal is to identify a new bullish or bearish trend as early as reasonably possible and then to ride that trend (or avoid that trend if the trend is bearish) as long as the trend remains in force.
For testing purposes, we use only the weekly closing price for the S&P 500 Index, and all hypothetical trades are executed at the weekly closing price.
The strategy
We will keep it as simple as possible.
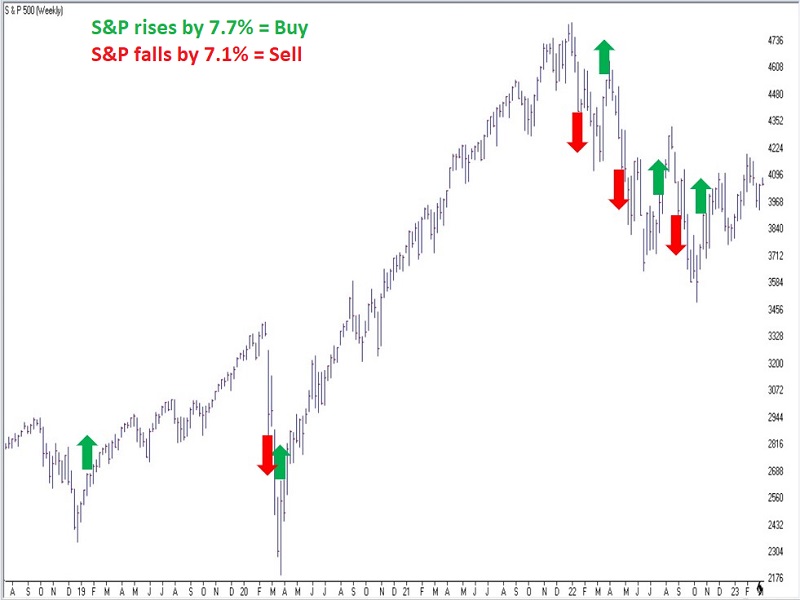
- A new bullish trend begins when the S&P 500 closes +7.7% or more above its most recent low weekly close
- A new bearish trend begins when the S&P 500 closes -7.1% or more below its most recent high weekly close
That's it. We started our test on 1920-01-02. Since then, there have been 115 completed buy and sell signals in just over 103 years.
The chart below (courtesy of AIQ TradingExpert) displays the signals on a weekly S&P 500 chart since 2018.
Measuring results provides some good news
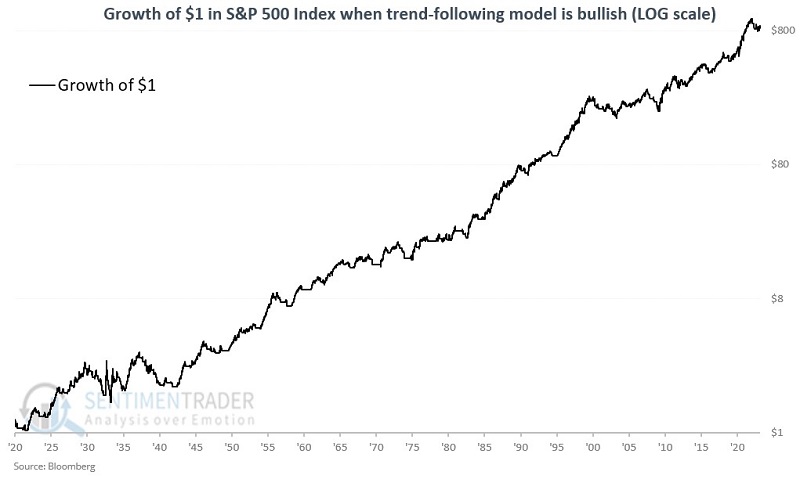
First, the good news. From 1920 into 2023, during buy signals, the S&P 500 gained +84,408%, versus +42,893% for a buy-and-hold approach. During sell signals, the S&P 500 lost a cumulative -49.4%. So statistically, the strategy theoretically outperformed buy-and-hold by almost 2-to-1.
The chart below displays the cumulative performance during buy signals on a logarithmic scale.
In contrast, the chart below displays the cumulative performance during sell signals.
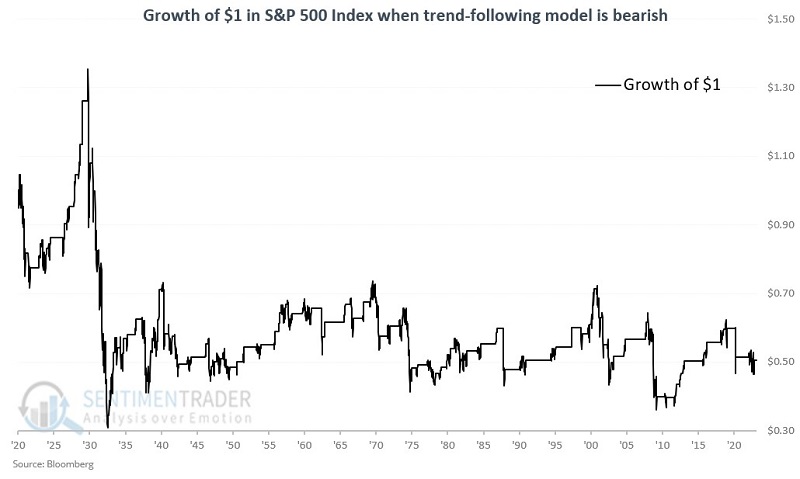
So clearly, we can state that this particular trend-following strategy outperformed a buy-and-hold approach over the past 103 years.
Measuring results provides some bad news
The numbers above can provide confidence that things will work out over the long term. Nevertheless, with any trading or investment strategy, there are potential pitfalls. This one has some that need to be considered.
First, note that if one were to trade this particular strategy in a taxable account, every sell signal along the way would result in a taxable event. Over time this could conceivably eat up whatever advantage might have been gained by using the strategy.
The other bigger question regards maintaining the discipline to take every signal as it comes. If you follow the market at all, you know that at any given time, there are a thousand and one reasons to be in the market and myriad reasons to be out of the market. The easiest mistake for any systematic trader to make is to ignore the next signal because - the Fed is doing blank; inflation is too high, economists are predicting a recession, the deficit is too high, analysts are concerned about earnings, blah, blah, blah.
Finally (as we will highlight more clearly in a moment), this particular strategy experienced a great many "whipsaws," whereby it either called for selling at a loss or buying back in at a higher price from the S&P 500 level at the time of the previous sell signal. Many investors find it challenging to keep taking new trades after a series of such whipsaws.
Taking the trades as signaled can be more arduous psychologically than most people realize until the time comes to take the trade, and they hesitate to pull the trigger. Let's take a closer look at historical results to understand better what a strategy like this one entails.
Looking at buy and sell signal results
The table below displays the results of all 115 buy signals since 1920. The key things to note are:
- Only 45% of all buy signals ultimately ended with a gain
- The average gain was four times greater than the average loss
- There are 25 gains of +20% or more and no losses over -20% (the worst was the -16.4% plunge from 1932-09-23 through 1932-10-07)
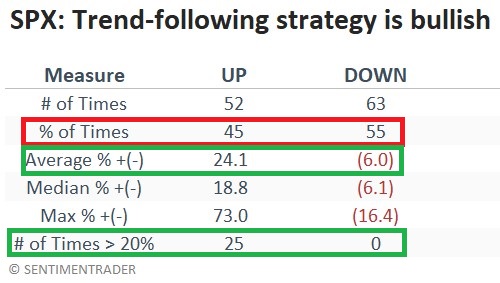
A winning percentage of less than 50% is not uncommon for trend-following strategies. Nevertheless, many investors are not "wired" to deal with a majority of trades ending in a loss.
The table below summarizes S&P 500 performance between all sell signals and each subsequent buy signal.
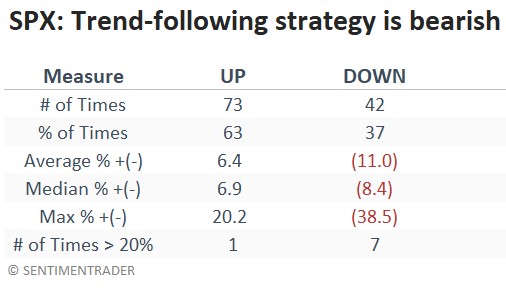
Ironically, the sell signals ended with a gain for the S&P 500 fully 63% of the time - a much higher Win Rate than the buy signals. However, the average gain was only +6.4%, and seven sell signals witnessed an over 20% loss. The bottom line is that the primary "edge" to this strategy is the ability to miss a significant portion of large declines.
One more perspective: results by decade
As I alluded to earlier, for many trading strategies, the question is not so much "will it generate profits over time?" The real question is, "will you stick with it long enough to enjoy the benefits." One question to ask yourself regarding any strategy or system is, "how long will I continue to trade it if it is underperforming?" The table below displays results on a decade-by-decade basis.
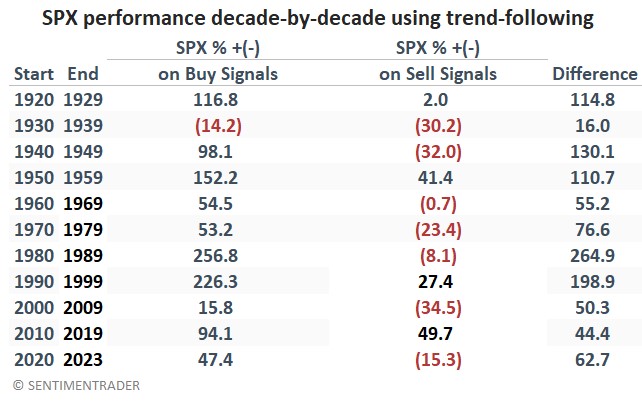
The good news is that the only decade that saw the buy signals generate a net loss was the 1930s. Likewise, the S&P 500 performed better during the buy signals than during the signals in every single decade. That demonstrates good reliability.
But consider this: During the 1920s, 1950s, 1990s, and from 2010 through 2019, the S&P 500 generated a net gain during the sell signals. More pointedly, a trader following this exact strategy would have underperformed a simple buy-and-hold approach over an entire 10-year period during four of the last eleven decades.
The bottom line question: Would they have continued to follow every signal after underperforming for an entire decade? Every investor must answer that question for themselves.
Latest results
The most recent signal was a buy signal on 2022-10-28, with the S&P 500 at 3,901.06. The highest weekly close since then was 4,136.48 on 2023-02-03. If that high is not exceeded, a sell signal will occur the next time the S&P 500 closes a week at or below 3,842.79.
What the research tells us…
Trend-following is a viable approach to trading, and many tests beyond the one above have shown this to be the case. But no strategy is perfect, and every strategy has weaknesses and ups and downs. The real key for an investor considering any strategy is to honestly assess what will work for them and then resolve to stick to it. As stated earlier, the strategy highlighted here is not a recommendation. Nevertheless, for an investor considering implementing this idea, using it with only a portion of one's capital in a tax-free account probably makes the most sense.