
Trend Following in one minute a month

Key Points
- Trend-following is not about "timing the market" per se. It is about trying to ride bullish trends for the bulk of big rallies and is primarily about avoiding riding a bear market all the way to the bottom, fully invested
- The two big problems with trend-following are 1) whipsaws and 2) too much trading
- This piece highlights one method intended to achieve the hoped-for goals without experiencing (too much of) the potential pitfalls
The Origin
Many years ago, I heard investor and Forbes columnist Kenneth Fisher suggest that investors wait at least three months after a top in price to worry about whether or not we are in a bear market. That has turned out to be good advice. He later spoke more about it in this article. That idea provided the impetus for a simple trend-following model I developed based on that "wait three months" idea.
First, a few key points
- Trend-following is NOT about picking tops and bottoms or timing the market with "uncanny accuracy." So don't expect any trend-following system to do so
- The fundamental goal of trend-following is to avoid riding the major soul-crushing (and wealth-destroying) major bear markets all the way to the bottom fully invested (i.e., preserve capital during a decline AND have cash to invest after the bottom)
- In the process, you must also accept that there will be whipsaws - times when you sell at one price and then are forced to buy back in at a higher price
This seems like a good time to invoke:
Jay's Trading Maxim #72: The purpose of trend-following methods (and stop-loss orders) is NOT to maximize your profitability. Their sole purpose is to "save your sorry assets."
The Good News
- Starting in November 1970, this system has beaten a buy and hold strategy
- This system requires no math. There are no moving averages, etc. Anyone can look at a monthly S&P 500 bar chart and generate the signals. And it literally takes less than 1 minute per month to update
The Bad News:
- Every trend-following method known to man experiences whipsaws, i.e., a sell signal followed by a buy signal at a higher price. This system is no exception
- Due to said whipsaws, this system will occasionally significantly underperform buying and holding the S&P 500
OK, with all the caveats in place, here goes.
The JK Monthly SPX Bar Chart Trend-Following System
- This system uses a monthly price bar chart for the S&P 500 (SPX) to generate trading signals
- For this method, analysis is done ONLY at the end of the month
- Any trading action will take place at the close of the month (or on the next open)
A buy signal occurs when:
- The high for the SPX this month is above its highest price of the previous six calendar months (the actual buy signal occurs at the end of the month)
A sell signal occurs as follows:
a) SPX registers a month where the month's high is above the previous month's high and then goes three consecutive monthly bars WITHOUT exceeding the first month's high price. We call the first month's high a "swing high."
b) Once this happens, the lowest low for SPX registered during the three months after the first month is deemed as the "sell trigger price."
c) Once a sell trigger price is established, an actual sell trigger occurs at the end of the current month IF the low for the current month is below the "sell trigger price."
HOWEVER,
d) If, before triggering an actual sell signal, SPX makes a new monthly high above the previous "swing high," then the sell signal alert is aborted, and the "sell trigger price" is no longer active.
NOTE: It takes a minimum of five months for a signal to occur using this method:
- The "swing high" month
- Three months following the swing high to establish the "Sell trigger price"
- At least one month for SPX to make a monthly low below the "Sell trigger price"
Sounds complicated, right? It's not. Let's illustrate with some charts.
A trip through the decades using JK trend-following
In the charts that follow:
- An Up green arrow marks a buy signal
- A Down red arrow marks a sell signal
- A horizontal red line marks a "sell trigger price"
- Sometimes a sell trigger price is hit and is marked by a down red arrow as a sell signal. Other times a sell trigger price is aborted by SPX, making a new high and negating the potential sell signal
- The month-end dates for buy and sell signals are listed
1970-1979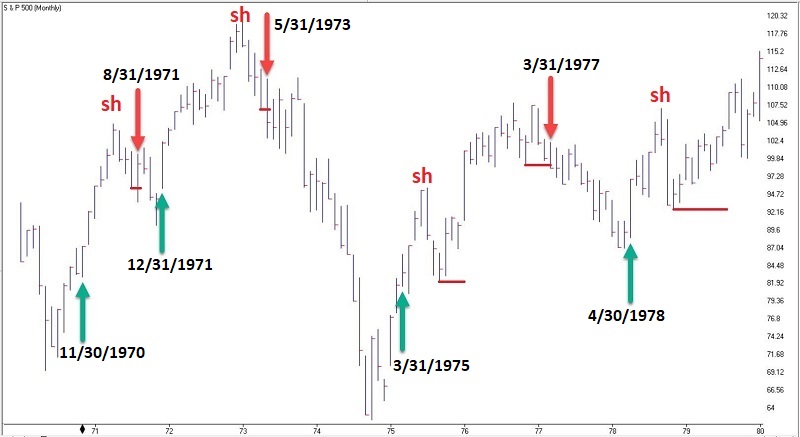 1980-1989
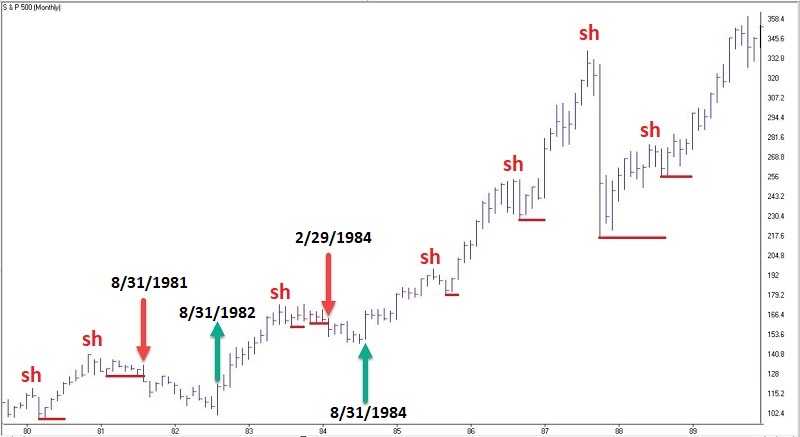 1990-1999
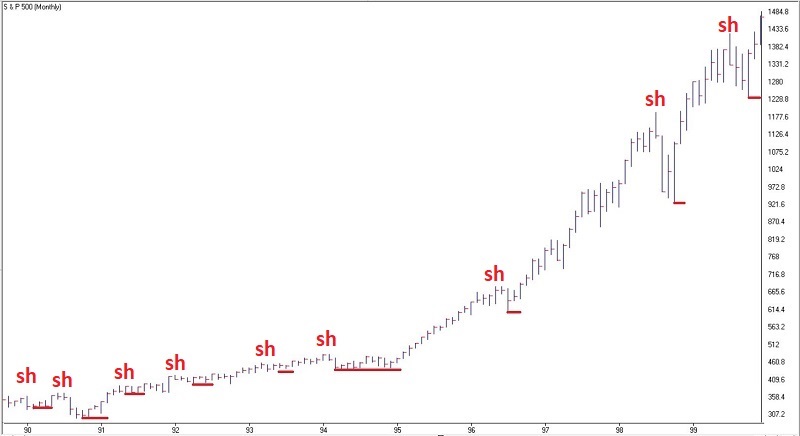 2000-2009
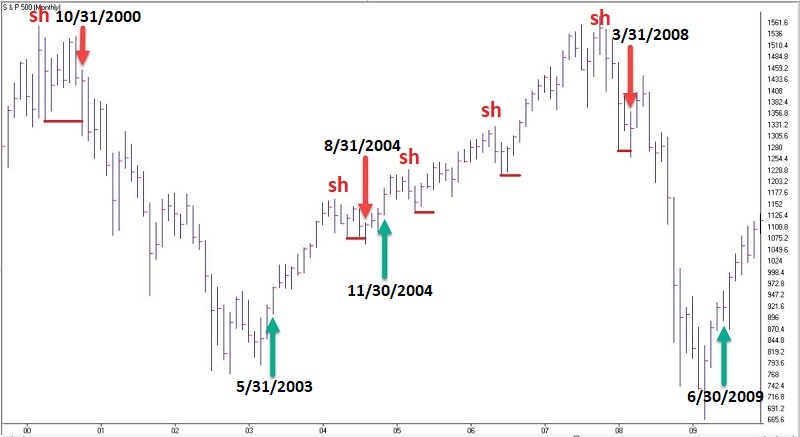
2010-2019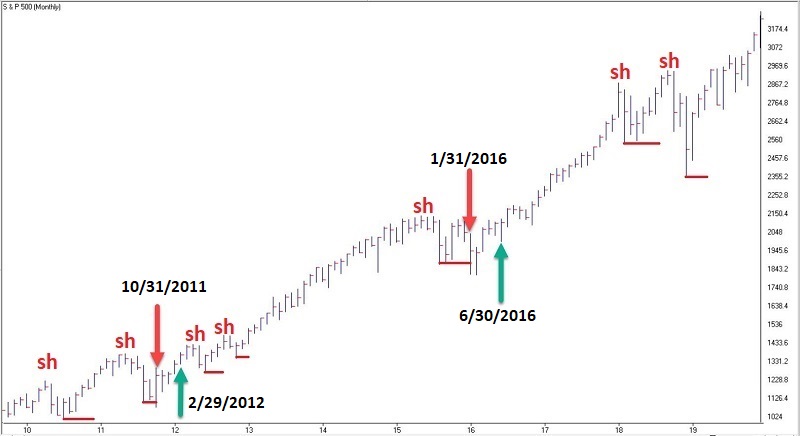 2020-2022
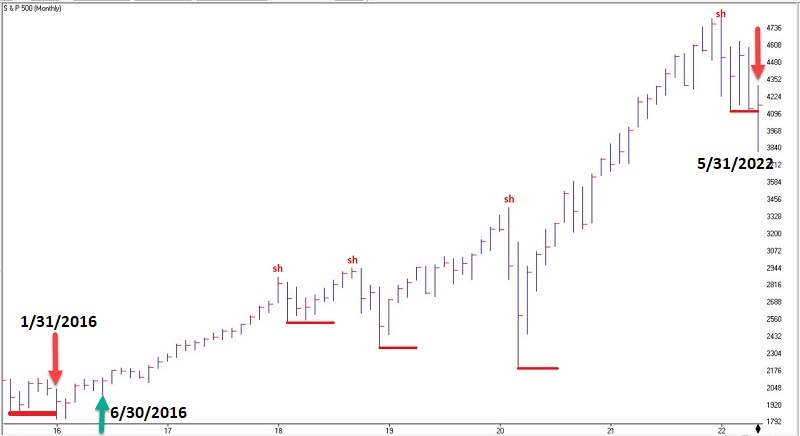 The most recent previous was a buy signal on 6/30/16. Now a new sell signal has occurred on 5/31/2022.
Examining Results
The chart below displays the growth of $1 invested in the S&P 500 Index only when the trend-following method described has been bullish since 1970.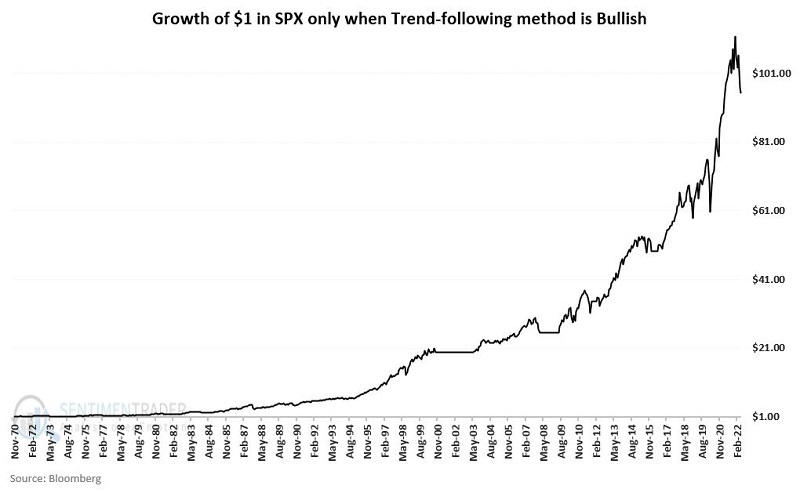
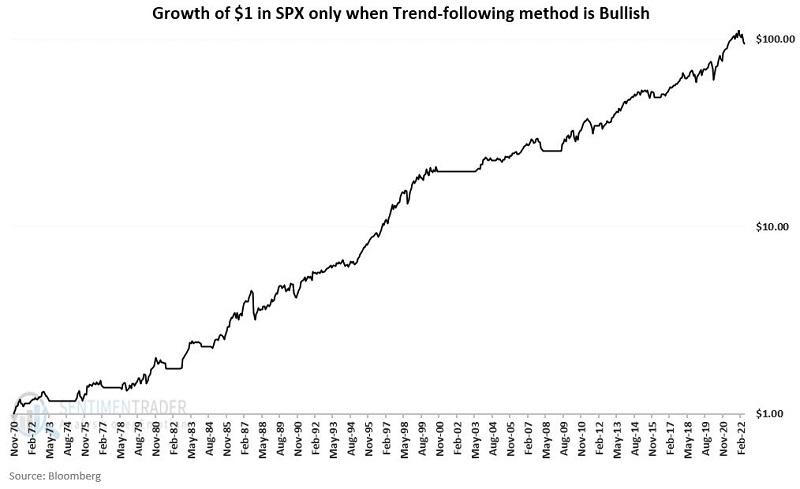
The chart below presents the same data on a logarithmic scale to better illustrate the long-term consistency.
Now let's consider the plight of the market when the method is bearish. The chart below displays the growth of $1 invested in the S&P 500 Index only when the trend-following method described above has been bearish since 1970.
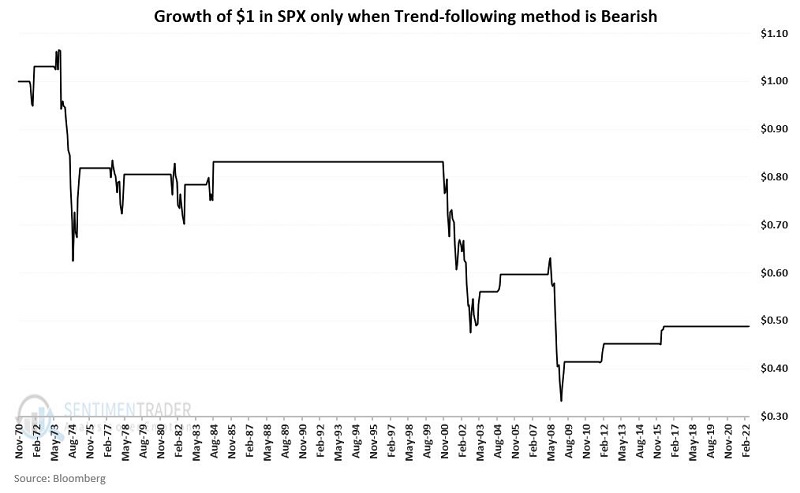
The results in the chart above clearly illustrate the benefits and occasional flaws associated with this approach. Following this strategy allowed an investor to miss a large portion of the 1973-1974, 2000-2002, and 2007-2009 bear markets - avoiding capital destruction on the way down and having cash to invest after the eventual bottom.
Likewise, we see several "whipsaws," where the market moved higher between the sell and buy dates. As I said earlier, this type of action is unavoidable and is the price one pays for the benefit of missing the big down moves.
The tables below display the numerical results for both the bullish and bearish periods.
Bullish Periods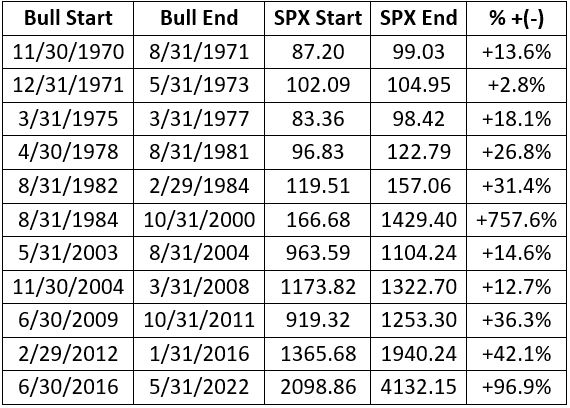
Bearish Periods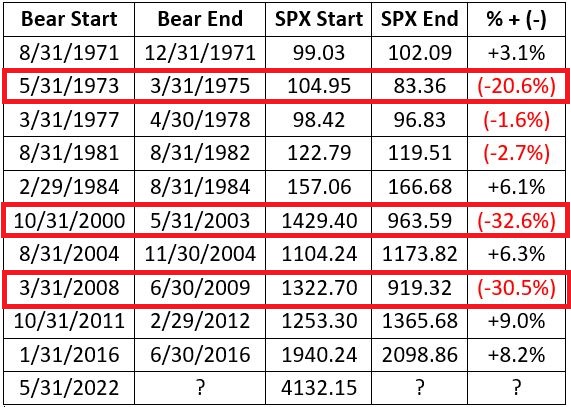
Note the pattern (as promised) of occasional whipsaws (where you sell and later are forced to buy back higher) interspersed with major bear markets when selling and buying back at a much lower level can make a huge difference in the growth of one's equity. So what will happen between the 5/31/2022 sell and signal and the next buy signal? Who knows. As a disciplined trader, this particular method fits in well with the organized approach to investing I wrote about here.
What the research tells us...
So, is this "The World Beater, Best Thing Since Sliced Bread" system? Not at all. If you had started using this system in real-time in March of 2009, chances are by now you would have abandoned it and moved on to something else, as the whipsaw signals in 2011-2012 and 2016 have the system performing worse than buy and hold over this period.
But here is the thing to remember. The chances are good that prolonged bear markets have not been eradicated, never to occur again. 100+ years of market history demonstrates that bear markets of 12 to 36 months are simply "part of the game." And it is riding these bear markets to the depths that try investors' souls - and, more significantly, wipe out a lot of their net worth in the process.
When the next 12-to-36-month bear market rolls around - and it will - a trend-following method similar to the one detailed here may help you "save your sorry assets" (so to speak).